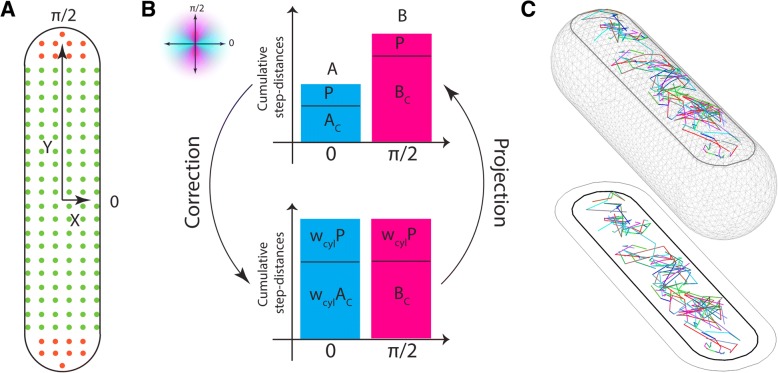
Fig. 3.
Curvature correction factor. In a, a schematic representation of a B. subtilis average cell aligned to coordinate axes. The polar and cylindrical regions are represented by orange and green, respectively. b Projection of curvature on observation plane impairs equality between components of cumulative step-distances along x (cyan) and y (magenta) axes. P (P) and Ac (Bc) are the cumulative step-distances observed in the polar and cylindrical regions along short (long) axis. Equality can be restored by properly weighing these values by the factors wcyl = Bc/Ac and w = B/A, from which the curvature correction coefficient can be obtained (see Methods). c A realistic three-dimensional representation of tracks of the protein YbfF show that in our set-up, the curvature effect is not too pronounced. The region accessible with our depth of focus is delimited by the black curve. On the xy plane, we show the projections of observed boundary (gray), whole cell boundary (black), and the observed tracks

