
Fig. 7.
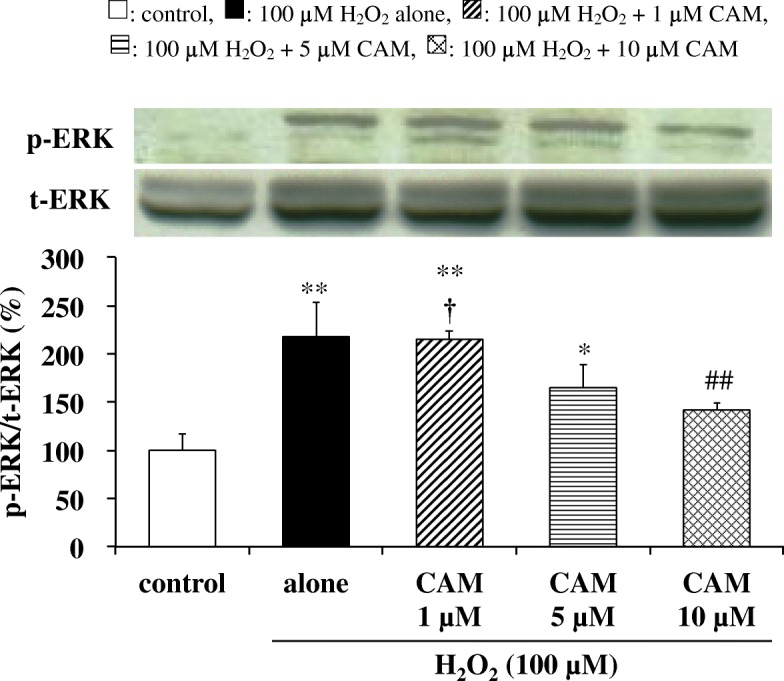
Effects of CAM pretreatment on p-ERK expression in SAECs stimulated with H2O2. p-ERK and t-ERK protein levels were detected by Western blotting (upper, representative blot images; lower, quantification of bands). Samples were obtained from cell pellets of control cells, of cells stimulated with 100 μM H2O2 alone, or of cells pretreated with 1, 5, or 10 μM CAM for 72 h before stimulation with 100 μM H2O2 for 0.5 h. The data are expressed as the p-ERK/t-ERK ratio. Data are presented as means ± SD of three independent experiments. *p < 0.05, **p < 0.01 vs. control cells, ##p < 0.01 vs. cells stimulated with H2O2 alone, †p < 0.05 vs. cells pretreated with 10 μM CAM