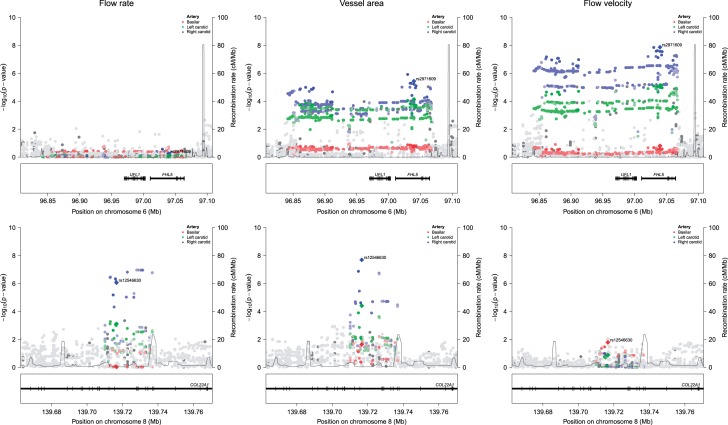
Figure 3.
Top genetic loci for cerebral blood flow. Regional association plots of the two genome-wide significant loci, 6q16.1 (upper row) and 8q24.23 (lower row). Associations are shown with the flow rate (left), vessel area (middle), and flow velocity (right) for three major cerebral arteries: the basilar artery in red, the left carotid artery in green, and the right carotid artery in blue.

