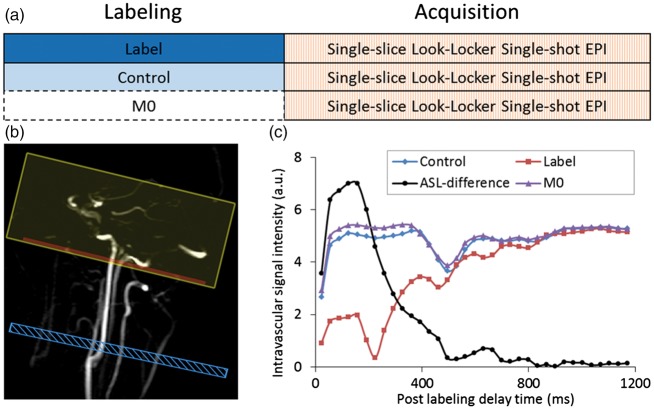
Figure 1.
Overview of a direct measurement of the labelling efficiency of pCASL with the schematic representation of the acquisition protocol in (a), the planning in (b) and the observed signals in (c). The passage of labelled spins is measured in an imaging plane superior from the labelling slab. Readout is performed with a Look-Locker readout with 90° excitation pulses assuming complete refreshment of spins within the imaging plane between two excitation pulses. Similarly, the passage of spins that have either experienced the control condition of the pCASL-labelling or which did not experience any RF (‘M0’) are measured. By correcting the ASL-signal (control-label) for T1-decay and by normalizing with respect to M0, the labelling efficiency can be calculated. Note that the first points of the label-curve represent negative magnetization, which has been made positive by the modulus operator; this has been taken into account in the curve showing the ASL-difference signal. For details, see Chen et al.37 Blue box indicates labelling plane, the red box the imaging slice and the yellow box a saturation volume to suppress venous signal.

