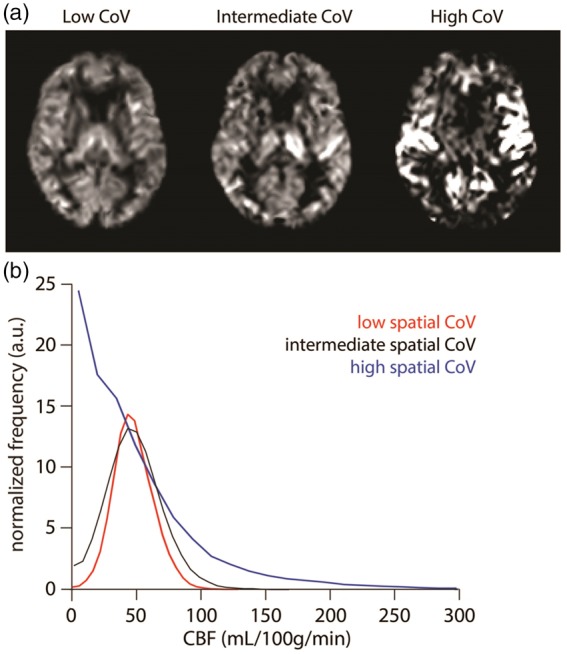
Figure 2.

Cerebral blood flow (CBF) images (a) and histograms (b) are shown for three selected participants from a larger clinical study with, respectively, the lowest (39.3%), intermediate (54.0%) and highest (113.6%) spatial coefficient of variation (CoV). Histograms proof that the subject with highest CoV has many voxels with almost zero CBF, but also a large tail of voxels with high CBF; both findings point to increased arterial transit time. For the intermediate and low CoV, the histograms become more-and-more symmetric with less-and-less outlier voxels with high CBF-values. Image courtesy: Henk-Jan Mutsaerts (Brain Sciences Research Program, Sunnybrook Research Institute, Toronto, Canada). Image reproduced with permission from Mutsaerts et al.62
