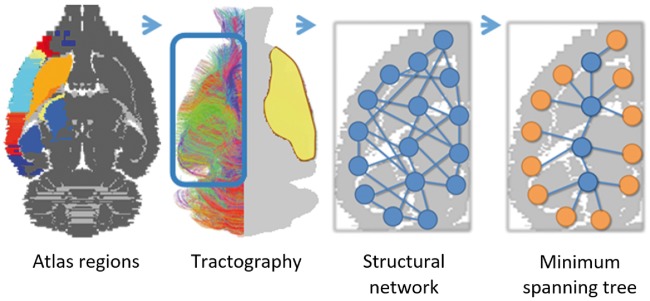
Figure 1.
Image processing pipeline. A schematic overview of the image processing steps. After registration with the Paxinos and Watson rat brain atlas, 42 unilateral brain regions were resampled in subject space and used to extract weighted structural networks from diffusion-based tractography in the contralesional hemisphere. A minimum spanning tree (MST) was extracted from the weighted networks and quantified using MST metrics. Atlas labels are plotted on top of a grayscale image of a transverse rat brain slice (first picture). Color-coded contralesional fiber tracts are shown for a single subject (>5 mm tract length only; approximate lesion site depicted in yellow) (second picture). Magnified illustrations display the contralesional cerebral network with nodes and edges (third picture), and corresponding MST (MST leaf nodes in orange) (fourth picture).

