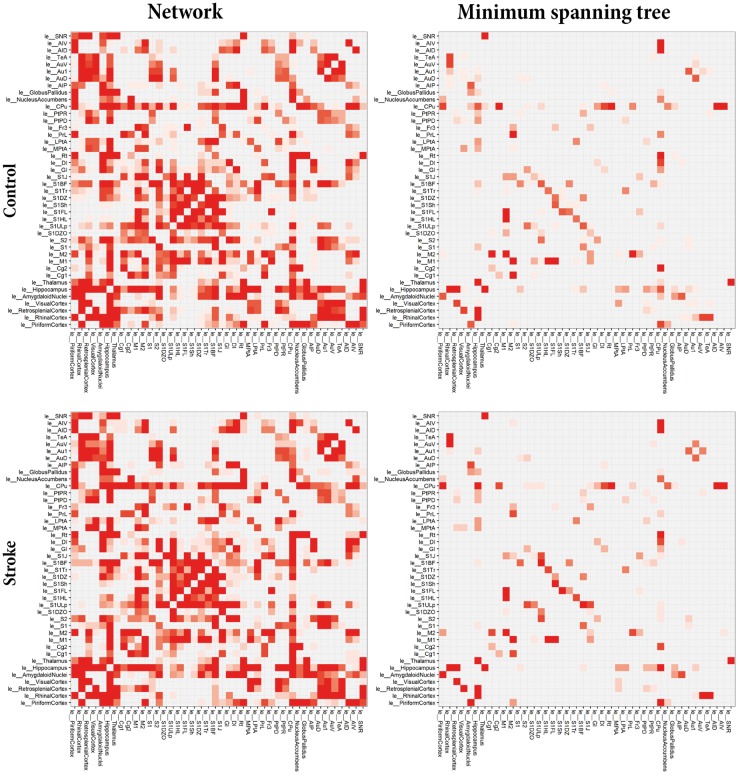
Figure 3.
Average connectivity matrices for the total networks and minimum spanning trees. Average structural connectivity matrices of total networks (left) and MST backbones (right) of the left (contralesional) hemisphere for control (top) and stroke (bottom) animals. Connectivity weights are based on prevalence of connections for each group, ranging from low (white) to high (red). ‘le_[Name]’ indicates node in left (contra-lesional) hemisphere. The MSTs, reflecting the backbone connections, primarily consisted of connections between sensorimotor regions, such as the primary motor cortex, the secondary motor cortex, caudate putamen and the forelimb and hindlimb regions of the primary somatosensory cortex. Overall, the connectivity pattern in the contralesional hemisphere of stroke animals was quite similar to its counterpart in control animals, although some subtle differences are apparent in the connectivity matrices.

