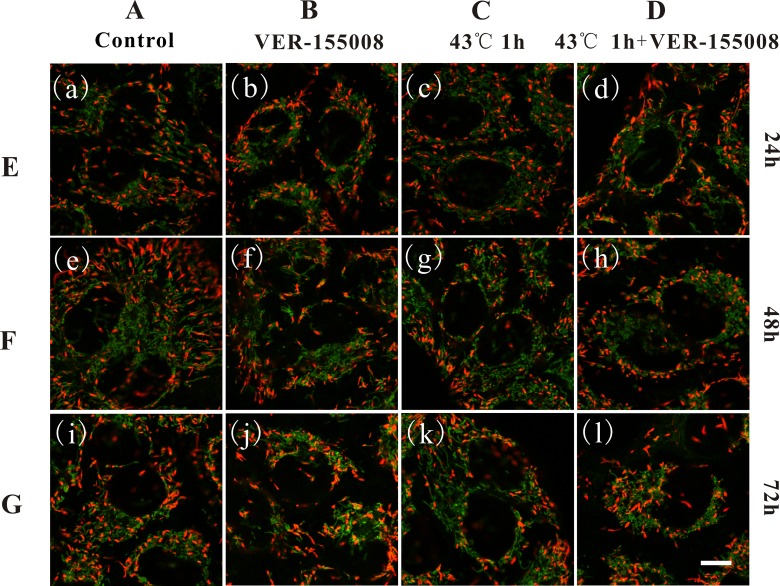
Figure 2.
Fluorescence imaging of mitochondrial membrane potential in MCF-7 breast cancer cells based on 5,5’,6,6’-Tetrachloro-1,1’,3,3’-tetraethylbenzimidazolylcarbocyanine iodide (JC-1). Column A showed control cells without any treatment, column B showed cells with 20 μmol/L VER-155008 treatment, column C showed cells with heat shock (HS) treatment (43°C, 1 hour), column D showed cells with 20 μM VER-155008 and HS (43°C, 1 hour) treatments. Rows E, F, and G showed the measurements at 24, 48, and 72 hours after the beginning of treatments, respectively. Scale bar: 10 μm. ×100, numerical aperture (NA) indicates 1.4 oil objective, zoom 2.

