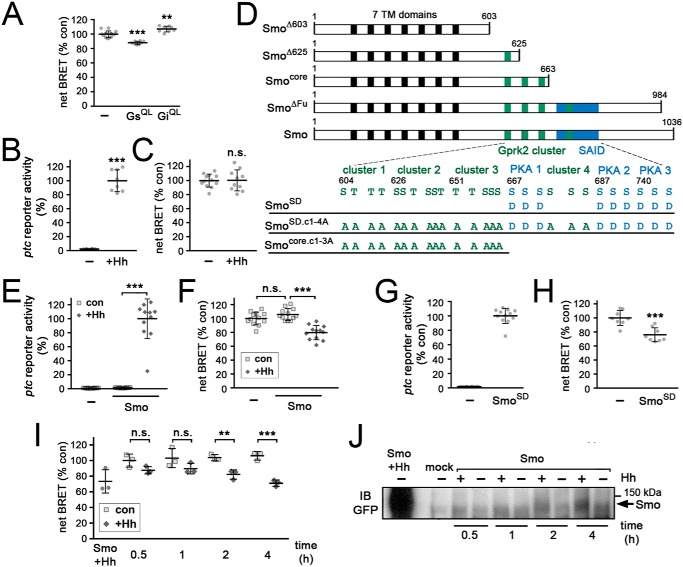
Figure 1.
Strong Smo activation stimulates cAMP production in S2 cells. Graphed data represent mean ± S.D. A, EPAC-BRET assay to measure changes in cAMP levels in S2-R+ cells in response to expression of constitutively active forms of Gαs (GαsQ215L) or Gαi (GαiQ205L). t test versus cells transfected with empty vector (−): **, p < 0.01; ***, p < 0.001. B, ptc-luc reporter assay monitoring target gene activation in mock- and HhN-transfected S2-R+ cells. t test: ***, p < 0.001. C, measurement of cAMP levels by EPAC-BRET assay in mock- and HhN-transfected S2-R+ cells. t test: n.s., not significant. D, schematic diagram of truncated/mutated Smo variants used in this study (not to scale). The relative locations of the 7-transmembrane domains (black boxes), the fours clusters of Gprk2 phosphorylation sites (green boxes), and the SAID containing three clusters of PKA/CkI phosphorylation sites (blue box) are indicated. Numbers refer to amino acid positions in Smo. E, ptc-luc reporter assay monitoring target gene activation in control and SmoWT-GFP transfected cells, with and without HhN co-transfection. t test: ***, p < 0.001. F, measurement of cAMP levels by EPAC-BRET assay in cells transfected with empty vector (−), SmoWT-GFP, or SmoWT-GFP plus HhN. t test: ***, p < 0.001; n.s., not significant. G, ptc-luc reporter activity in cells transfected with empty vector (−) or SmoSD-GFP. H, EPAC-BRET assay of cAMP levels in cells transfected with empty vector (−) or SmoSD-GFP. t test: ***, p < 0.001. I, EPAC-BRET assay of cAMP levels in SmoWT-GFP-expressing cells treated for 0.5, 1, 2, or 4 h with medium conditioned by control cells or cells expressing HhN, or co-transfected with HhN expression plasmid (Smo + Hh). t test: **, p < 0.01; ***, p < 0.001; n.s., not significant. J, immunoblot (IB) analysis of SmoWT-GFP in cells treated as in I.

