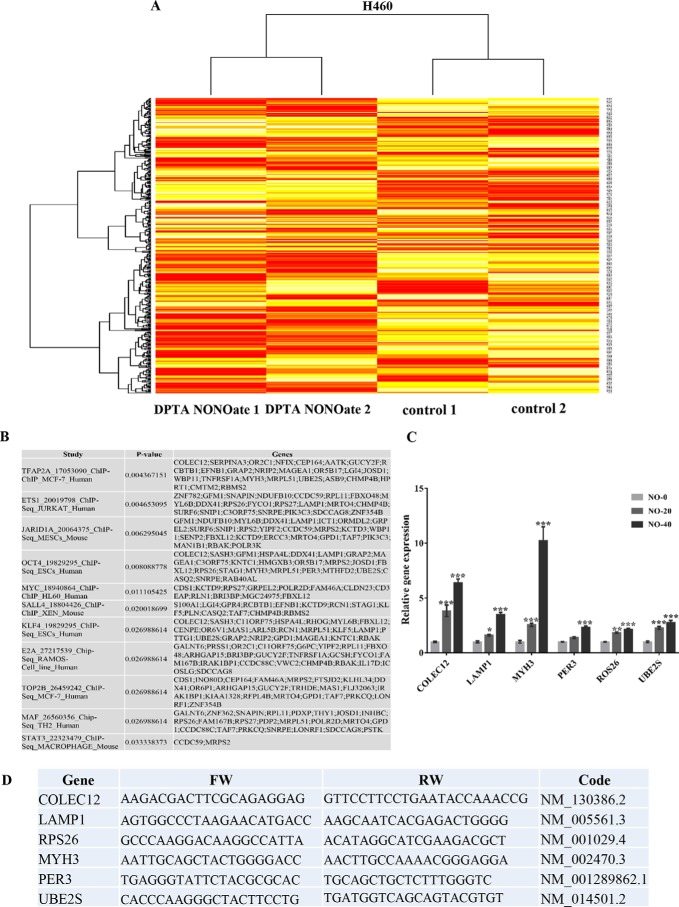
Figure 3.
Microarray analysis of the effect of nitric oxide on H460 cells. H460 cells treated with DPTA NONOate and untreated control were subjected to analyzing the mRNA expression profile by Affymetrix chips as per the manufacture's procedure. A, gene probes with a significant difference (p < 0.05) between DPTA NONOate-treated and the control group analyzed by CU-DREAM program generated heat maps of genes by the Bioconductor R statistic program. B, results form Enrichr-EhEA-2016 demonstrated the gene list of nitric oxide-mediated gene expression matched with targeted genes of transcription factors evaluated by ChIP-seq assay. C, qRT-PCR was used to verify the microarray results. The mRNA expression of Oct4 downstream targets, including COLEC12, LAMP1, MYH3, PER3, ROS26, and UBE2S, were subjected to RT-PCT analysis. The bars are means ± S.D. (n = 3). *, p < 0.05 versus nontreated cells; **, p < 0.001–0,01; and ***, p < 0.001. D, NO-inducing gene alteration (only form Oct4 axis) and its primer sequences for RT-PCR.

