Figure 4.
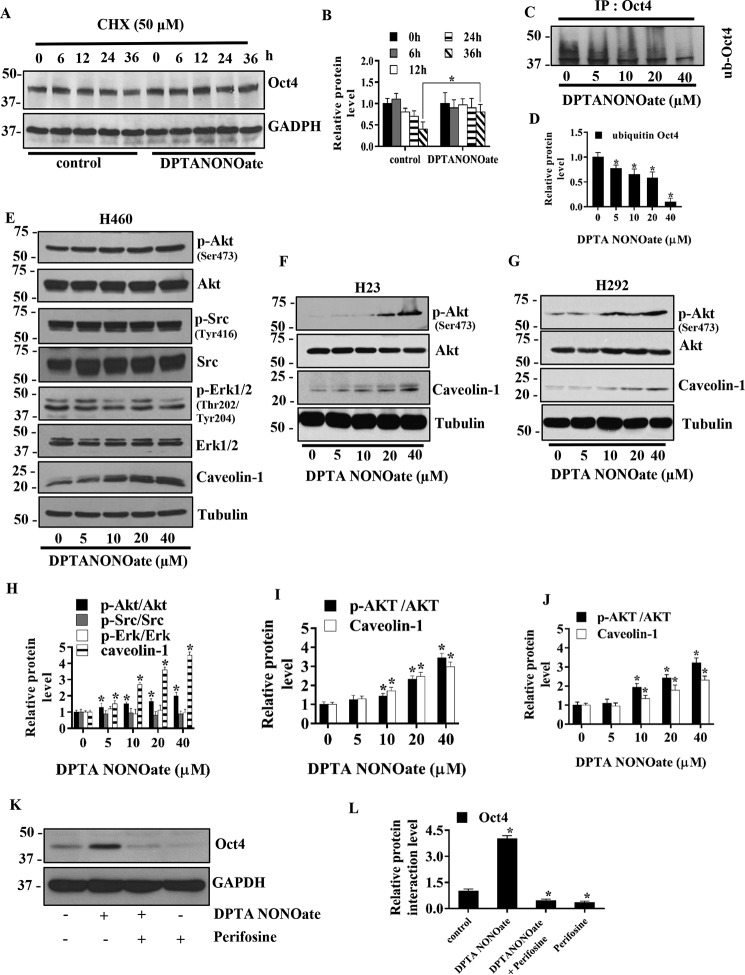
NO donor increases Oct4 stability through Akt-dependent mechanisms. A, H460 cells were treated with 40 μm DPTA NONOate and 50 μg/ml CHX for the indicated times and analyzed for Oct4 levels by Western blotting. The blots were reprobed with GAPDH to confirm equal loading of the samples. B, immunoblot signals of Oct4 were quantified by densitometry, and mean data from independent experiments were normalized and presented. The bars are means ± S.D. (n = 3). *, p < 0.05 versus nontreated cells. C, H460 cells were treated with DPTA NONOate (0–40 μm) and lactacystin (10 μm) for 12 h and subjected to immunoprecipitation (IP) of Oct4. The immunoprecipitation complexes were analyzed for ubiquitin level by Western blotting. D, immunoblot signals of ubiquitin were quantified by densitometry, and mean data from independent experiments were normalized and presented. The bars are means ± S.D. (n = 3). *, p < 0.05 versus nontreated cells. E, H460 cells were treated with DPTA NONOate (0–40 μm) for 5 days and analyzed for phosphorylated Akt (Ser-473), Akt, phosphorylated Src (Tyr-416), Src, phosphorylated ERK1/2, Eek (1/2), and Cav-1 by Western blotting. The blots were reprobed with tubulin to confirm equal loading of the samples. H23(F) and H292 (G) were treated with DPTA NONOate (0–40 μm) for 5 days and analyzed for phosphorylated Akt (Ser-473), Akt, and Cav-1 by Western blotting. The blots were reprobed with tubulin to confirm equal loading of the samples. The immunoblot signals H460 (H), H23 (I), and H292 (J) were quantified by densitometry, and mean data from independent experiments were normalized and presented. The bars are means ± S.D. (n = 3). *, p < 0.05 versus nontreated cells. K, H460 cells were treated with 40 μm DPTA NONOate, 40 μm NONOate + 2.5 μm perifosine (specific Akt inhibitor), or 2.5 μm perifosine for 5 days and subjected to Western blot analysis for Oct4 detection. L, Western blotting bands of Oct4 were quantified by densitometry, and mean data from independent experiments were normalized and presented. The bars are means ± S.D. (n = 3). *, p < 0.05 versus control cells.

