Figure 5.
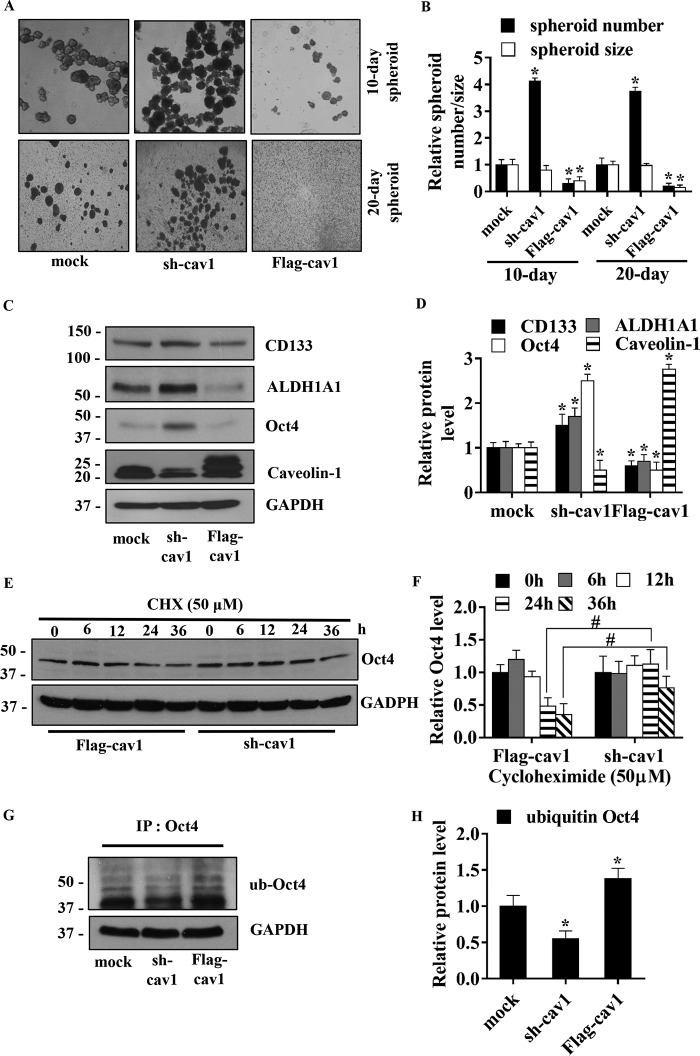
Caveolin-1 diminishes human lung CSC-like phenotypes. A, stable transfection of H460 with short hairpin plasmid (sh-cav1), Cav-1–overexpressing plasmid (FLAG-cav1), and control were suspended and subjected to spheroid formation assay. B, relative spheroid number and size were analyzed and calculated as relative to mock-transfected cells on days 10 and 20 of the assay. All plots are means ± S.D. (n = 3). *, p < 0.05 versus mock cells. C, stable transfections of H460 cells with sh-cav1, FLAG-cav1, or control were analyzed for Cav-1, CSC markers (CD133 and ALDH1A), and CSC transcription factor (Oct4) by Western blotting. Blots were reprobed with GAPDH as a loading control. D, immunoblot signals were quantified by densitometry, and mean data from independent experiments were normalized and presented. The bars are means ± S.D. (n = 3). *, p < 0.05 versus mock cells. E, stable transfections of H460 cells with sh-cav1 and FLAG-cav1 were treated with 50 μg/ml CHX at indicated times and analyzed for Oct4 level by Western blotting. The blots were reprobed with GAPDH to confirm equal loading of the samples. F, immunoblot signals were quantified by densitometry, and mean data from independent experiments were normalized and presented. The bars are means ± S.D. (n = 3). #, p < 0.05 versus FLAG-cav1-transfected cells. G, stable transfected H460 cells were treated with 10 μm lactacystin for 12 h and subjected to Oct4 immunoprecipitation (IP) of Oct4. The immune complexes were analyzed for ubiquitin by Western blotting. H, immunoblot signals were quantified by densitometry, and mean data from independent experiments were normalized and presented. The bars are means ± S.D. (n = 3). *, p < 0.05 versus mock cells.

