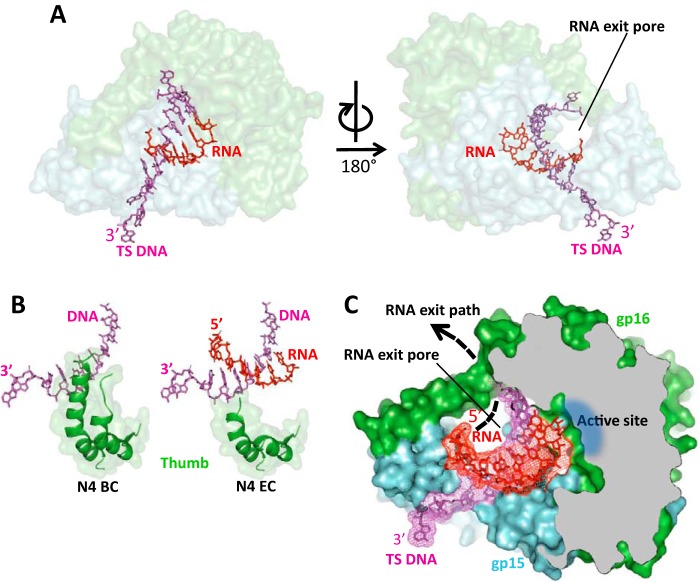
Figure 4.
The crystal structure of N4 RNAPII elongation complex. A, overall view of the RNAPII elongation complex assembled on scaffold 1. The orientation of the complex is the same as of the binary complex in Fig. 1C. N4 RNAPII subunits are shown as semi-transparent surface models colored as in Fig. 1B. DNA and RNA are shown as stick models in magenta and red, correspondingly. The location of the RNA exit pore is indicated. B, the Thumb subdomain is disordered in the RNAPII elongation complex. C, organization of the DNA:RNA hybrid in the elongation complex and location of the RNA exit pore. RNAPII is shown as a surface model of light blue (gp15) and light green (gp16) colors; some regions of the enzyme in frontal projection were removed to show the catalytic cleft. DNA (magenta) and RNA (red) are shown as stick models overlaid on electron density maps.

