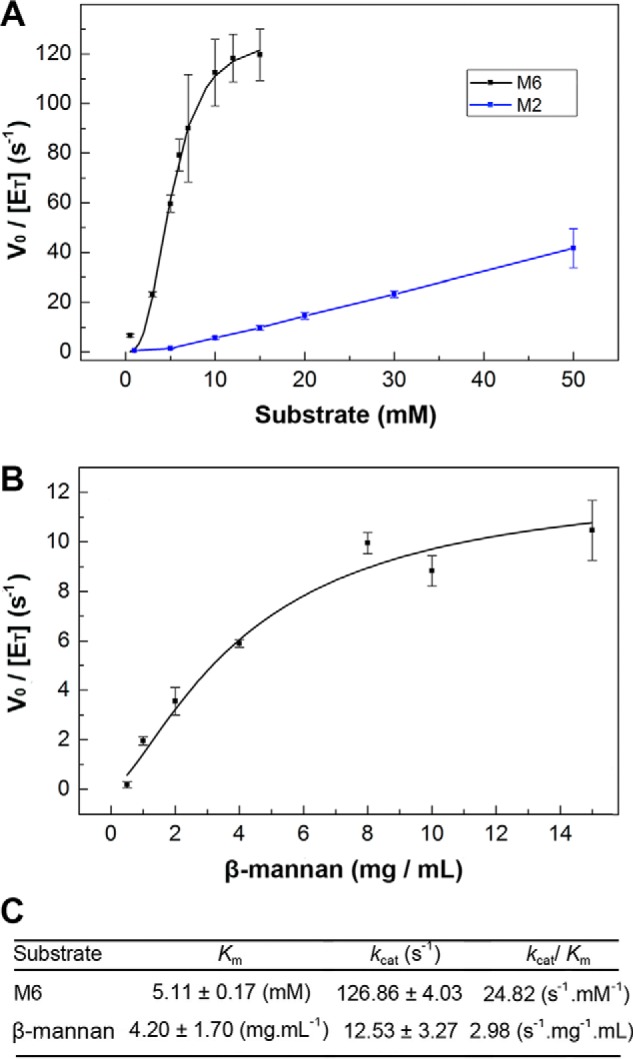
Figure 3.

Kinetic characterization of XacMan2A. A, M2 and M6 hydrolysis, with mannose release monitored by MS. For M2, saturation was not achieved. B, ivory nut β-mannan hydrolysis, where the reducing sugar release was measured by the 3,5-dinitrosalicylic acid method. C, kinetics parameters calculated for M6 and β-mannan substrates. Error bars, S.D.
