Figure 7.
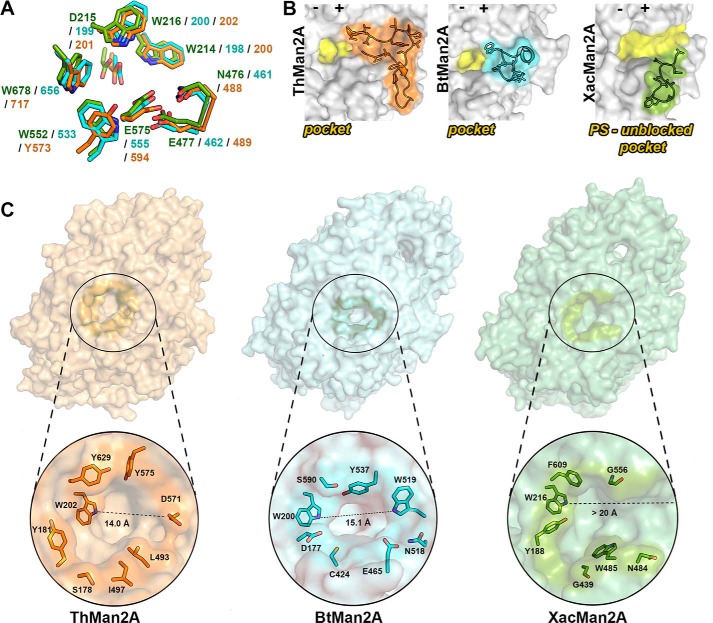
XacMan2A active-site topology differs from GH2 β-mannosidases. A, details of the conserved −1 subsite between XacMan2A (PDB code 6BYC), BtMan2A (PDB code 2JE8), and ThMan2A (PDB code 4CVU). Side chains of the active site residues are shown as sticks, and carbon atoms are displayed in green (XacMan2A), in cyan (BtMan2A), and in orange (ThMan2A). Negative and positive subsites are represented by minus and plus signs, respectively. B, representation of ThMan2A, BtMan2A, and XacMan2A active-site regions in yellow, highlighting the loops in ThMan2A (residues from Ala539 to Asp571, in orange), BtMan2A (residues from Pro514 to Thr527, in cyan), and XacMan2a (residues from Gly534 to Thr544) that contribute to determine the active-site topology (shown in yellow). C, surface representation of ThMan2A (orange), BtMan2A (cyan), and XacMan2A (green), highlighting the active-site vicinity, with some delimiting residues represented as sticks. The second Trp residue from the conserved WDW motif was used as reference for the active-site length measurements.

