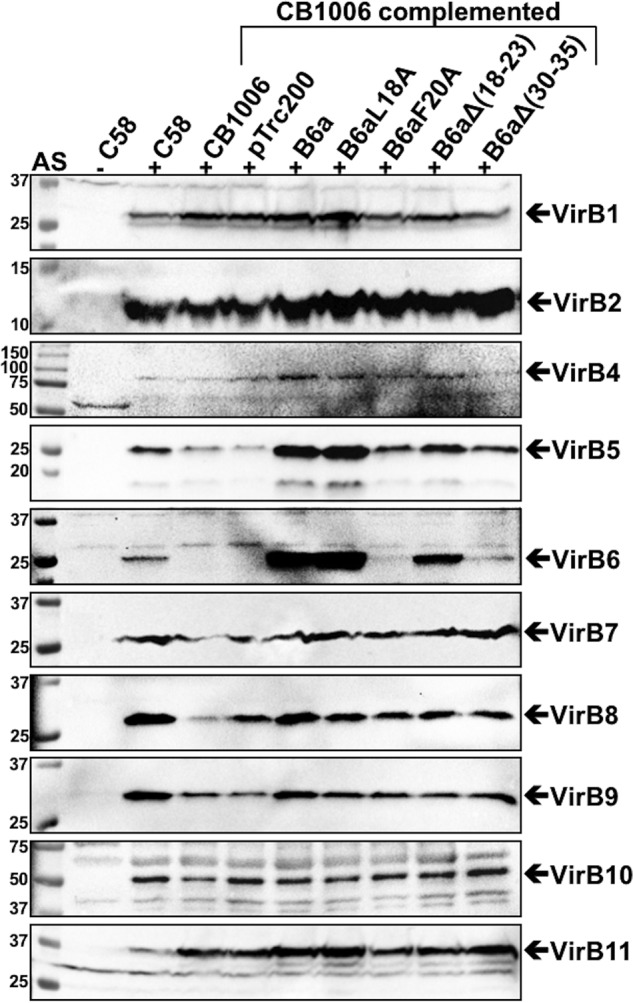
Figure 4.

VirB proteins levels in strains C58 and CB1006 after complementation with VirB6a and its variants. Shown are results of SDS-PAGE and Western blot analysis with VirB protein–specific antisera of A. tumefaciens C58 cultivated without (−AS) or with virulence gene induction (+AS) and virB6 deletion (CB1006) transformed with empty vector pTrc200- or pTrc200-expressing VirB6a or its variants VirB6aL18A, VirB6aF20A, VirB6aΔ(18–23), and VirB6aΔ(30–35). The signals of the expected molecular masses of VirB proteins are indicated by arrows. Molecular masses of reference proteins are shown on the left (in kilodaltons). Representative results of five repetitions are shown.
