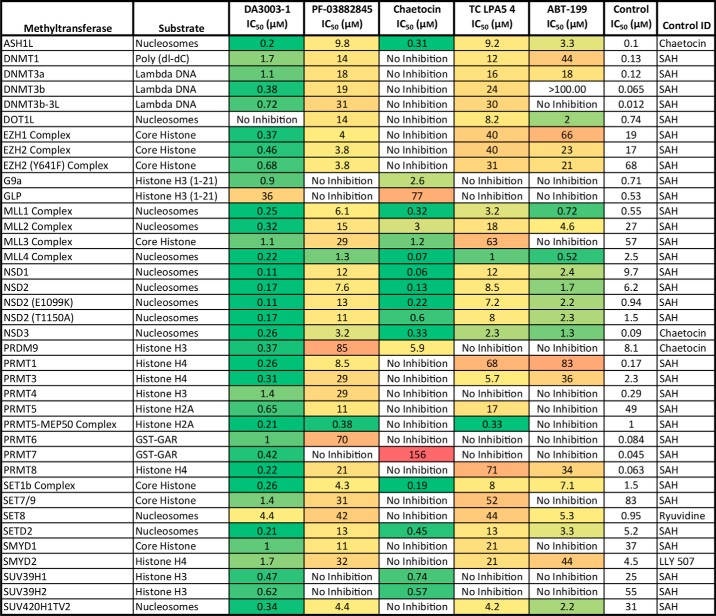
Table 4.
Selectivity of inhibitor compounds toward WT NSD2 was assessed by profiling 37 other methyltransferases, including the E1099K and T1150A NSD2 variants, with the HotSpot methyltransferase assay
The IC50 values for all test compounds are colored as a heat map with green indicating potent inhibition and red indicating weak inhibition. No color indicates no measurable activity. All values are derived from a single experiment except for those of WT NSD2, which result from a global fit of multiple data sets as indicated in Table 2.

