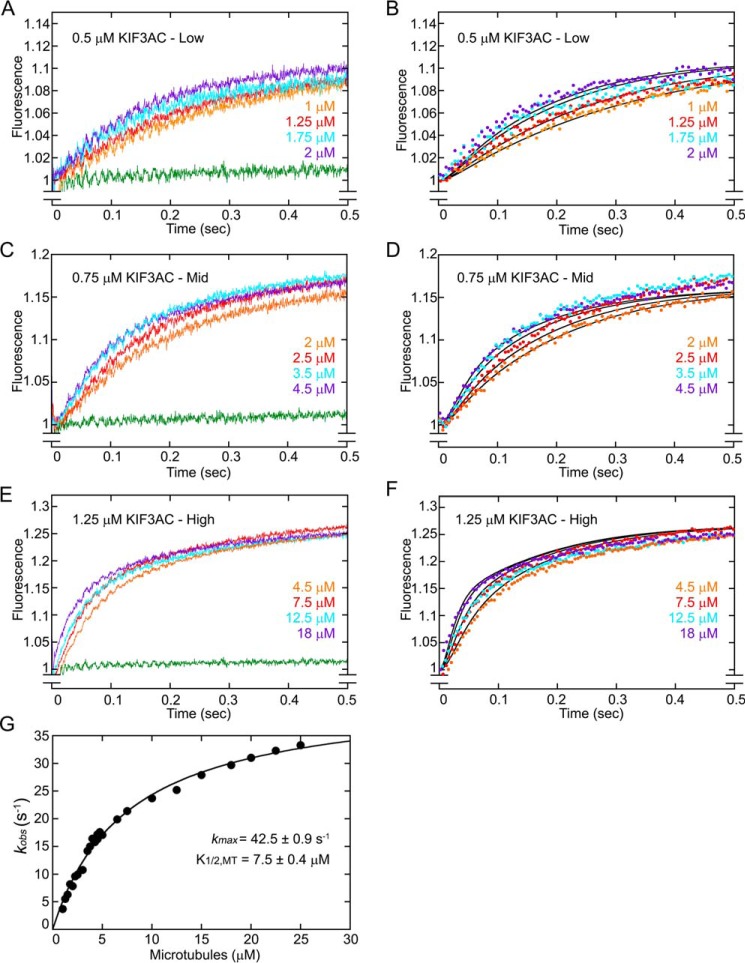
Figure 2.
KIF3AC fluorescence transients and simulations. KIF3AC was rapidly mixed in the stopped-flow instrument with varying concentrations of microtubules plus 50 μm mantATP (25 μm mantATP final concentration). Because the concentration of mantATP results in faster mantATP binding than ADP release, the fluorescence transients represent a readout of native ADP release after motor association with the microtubule (Fig. 1, E0–E2). A, low microtubule concentration family (1–2 μm) at 0.5 μm KIF3AC dimer. B, simulations of the low microtubule concentration family. C, mid-microtubule concentration family (2–4.5 μm) at 0.75 μm KIF3AC dimer. D, simulations of the mid-microtubule concentration family. E, high microtubule concentration family (4.5–18 μm) at 1.25 μm KIF3AC dimer. F, simulations of the high microtubule concentration family. G, a double exponential function was also fit to each transient, and the observed rates of the fast component were plotted as a function of microtubule concentration. The hyperbolic fit to the data provided the maximum rate constant for ADP release at 42.5 ± 0.9 s−1 with a K1/2,MT of 7.5 ± 0.4 μm (mean ± S.E.). Note too that the exponential fit to the transients provided the relative fluorescence amplitude for the fast component at 0.136–0.163 and 0.128–0.173 for the slower component. In simulation panels B, D, and F, the simulations are indicated by solid black lines, and only 100 of 1000 data points for each experimental transient are presented for clarity. The green transient in A, C, and E is the buffer control in the absence of microtubules at each KIF3AC concentration.

