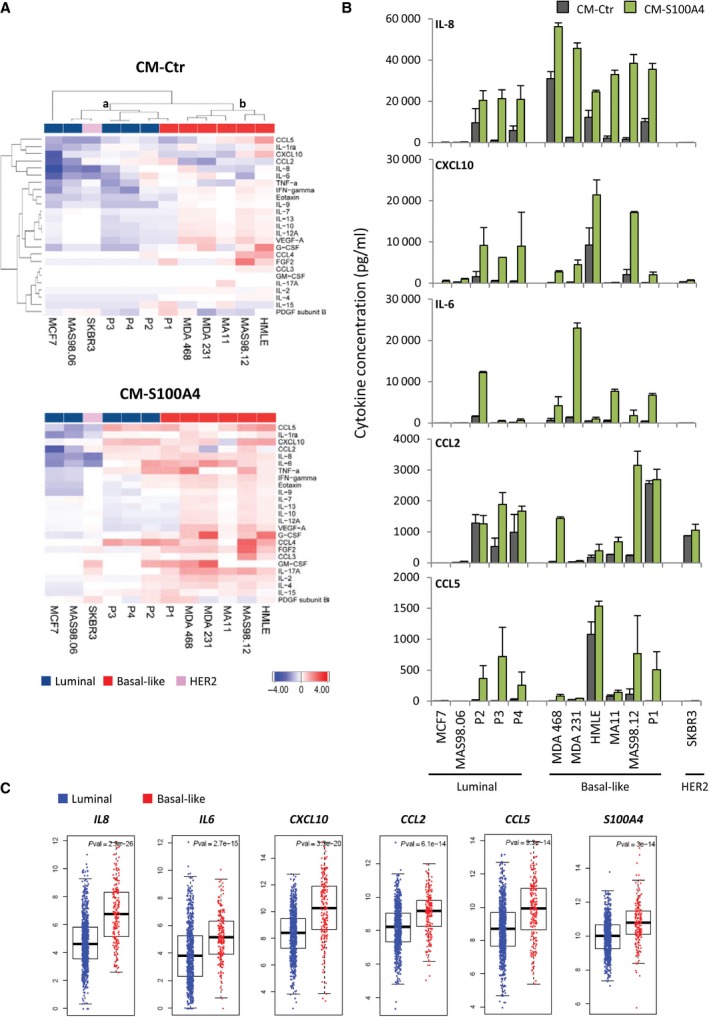
Figure 2.

Cytokines secreted by BCCs at control and S100A4‐stimulated conditions. Cytokine levels were assessed in a panel of BCCs, which include cell lines (MCF7, MDA468, MDA231, HMLE, MA11, SKBR3), ex vivo cultures from PDXs (MAS98.06 and MAS98.12), and primary cultures from patient biopsies (P1, P2, P3, and P4) that represented different BC subtypes as indicated. CMs were harvested from nonstimulated controls (CM‐Ctr) and cells stimulated with 2 μg·mL−1 rS100A4 for 24 h (CM‐S100A4), and analyzed for cytokines by the multiplex immunoassay. (A) Heatmaps of 25 of 27 cytokines (IL‐1β and IL‐5 were excluded as their levels were zero in the majority of the samples) across different BCCs in CM‐Ctr (top panel) and CM‐S100A4 (bottom panel). The cytokine data (average from two independent experiments) were log10‐transformed and median‐centered, CM‐Ctr data were clustered, and the resulting order of the BCCs and cytokines was used for visualizing both CM‐Ctr and CM‐S100A4 data. Two clusters (a and b) are shown. (B) Average concentrations (pg·mL−1) of five most abundant cytokines secreted by the individual BCC models in two independent experiments (error bars indicate SEM). (C) Gene expression levels of the most abundant S100A4‐inducible cytokines in luminal and basal‐like tumors (the data retrieved from TCGA's breast cancer cohort).
