
Figure 4.
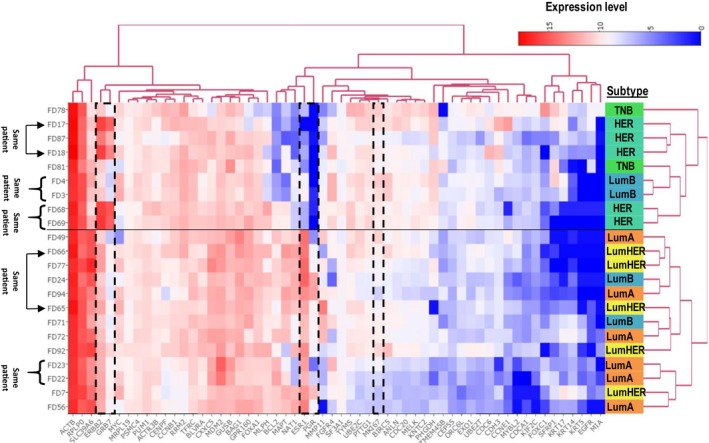
Clustering of PAM50 profiles. Unsupervised hierarchical clustering of samples based on PAM50 profiles demonstrates good correlation between IHC subtypes and key mRNA biomarkers. The X dimension represents transcripts and Y represents samples. We noted that five pairs of samples clustered close to each other within the two main sample subtype clusters. The horizontal line marks the separation of the two main sample clusters. Three of the five pairs of samples were immediately adjacent neighbors, and the other two were somewhat separated, one of which represented primary cancer and a lymph node metastasis (FD65 and FD66) and the other represented a multifocal, HER2‐amplified, and rapidly proliferating cancer (78% Ki67 IHC‐positive cells). Our interpretation of results is that the clustering pattern of samples underscores the technical reliability and biological validity of the FNA‐based expression profiling. All samples from the three patients with HER2‐amplified cancer showed highest levels of ERBB2 mRNA. This is illustrated by a dashed box together with GRB7, the mRNA expression of which is known to correlate with ERBB2. For comparison, additional boxes show expression levels of ESR1/PGR1 and MKI67, representing frequently used markers for IHC‐based subtyping of BC. An interactive representation providing data values can be explored at: http://research.scilifelab.se/andrej_alexeyenko/downloads/PEA/heatmap.PAM50.5subtypesXPAM50.v1.html