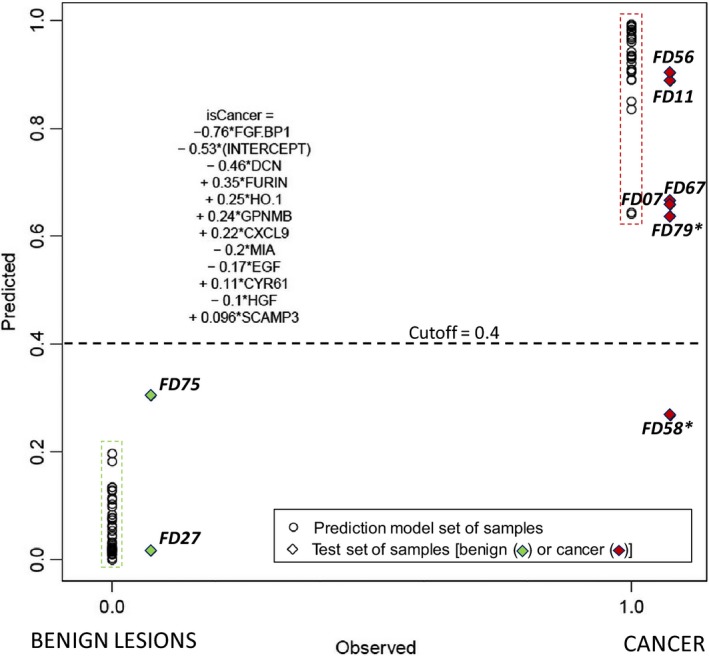
Figure 5.

Multiple regression modeling of PEA data produced a signature for discrimination between cancer and benign lesions via protein levels. ‘Observed’ denotes the final conclusive diagnosis for each of the samples at a binary scale (0/1, X‐axis), and ‘Predicted’ is the quantitative score ‘isCancer’ assigned by the algorithm of the same range (0–1) but at a continuous scale (Y‐axis). Member proteins in the signature are described in the text. The predicted score for a given sample is calculated as a sum of protein expression values multiplied by the indicated coefficients. Circles represent samples in the training set and diamonds represent those of the test set, also identified by the FD‐sample numbers. Sample numbers with (*) are from patients for whom two samples were analyzed: Sample FD58 was discarded after cytology examination, and a new sample, FD79, was taken 11 days later. All patients in the test set were thus classified correctly according to this algorithm.
