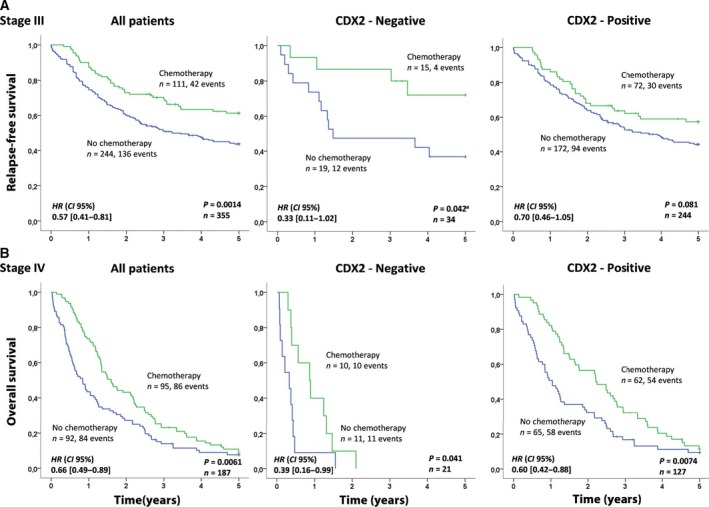
Figure 3.

Association between chemotherapy and survival related to CDX2 expression for stage III patients (A) and for stage IV patients (B). The Kaplan–Meier method was used to generate the survival plots and the log‐rank test was used to test for differences in survival between CDX2‐negative and CDX2‐positive cases, while univariable Cox regression (Wald) was used to generate hazard ratios (HR) and 95% confidence intervals (CI). Relapse was defined only after complete resection; hence, overall survival was used to evaluate survival in stage IV. aThe proportional hazards assumption is violated and the P‐value was generated using the generalized Wilcoxon test (Gehan–Breslow). Here, both the log‐rank test and the Wilcoxon test provide identical results.
