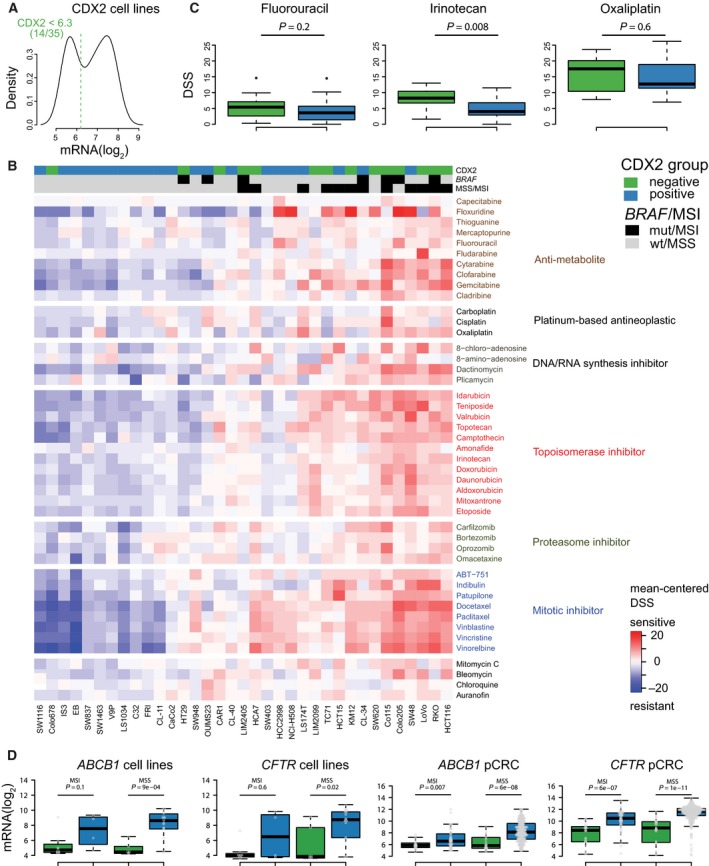
Figure 4.

CDX2‐negative CRC cell lines are more sensitive to conventional chemotherapeutics. CDX2‐negative cell lines are indicated by green, while CDX2‐positive cell lines are indicated by blue. (A) Cell lines were dichotomized according to CDX2 mRNA expression, as shown in the density plot. Dashed vertical line indicates threshold value, as determined by the Binarization Across Multiple Scales algorithm. (B) Drug responses of 35 CRC cell lines to conventional chemotherapeutics. Values represented are mean‐centered drug sensitivity scores with red indicating higher relative sensitivity. Samples are ordered according to complete linkage agglomerative clustering of the pairwise Manhattan distance matrix based on global gene expression. Drugs are ordered according to the mechanism of action. (C) Boxplots show DSS values for commonly used chemotherapeutics for CRC treatment. Higher values indicate higher drug sensitivity. (D) Boxplots show that both CDX2‐negative cell lines and primary CRCs have significantly reduced mRNA expression of ABCB1/MDR1 and CFTR/ABCC7. P‐values are from two‐sided Wilcoxon rank‐sum tests. Abbreviations: DSS, drug sensitivity score; GSA, gene set analysis; MSI, microsatellite‐instable; MSS, microsatellite‐stable; pCRC, primary colorectal cancer.
