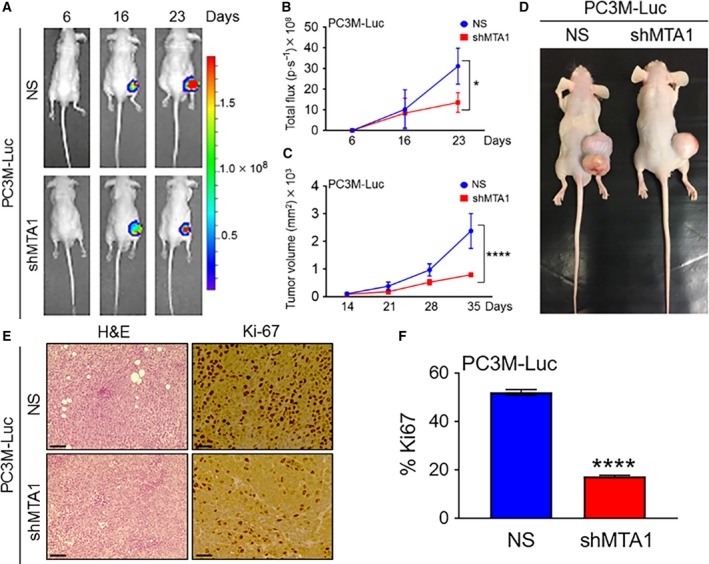
Figure 2.

MTA1 knockdown effectively diminishes tumor growth and progression in s.c. tumor xenografts. (A) PC3M‐Luc‐NS and PC3M‐Luc‐shMTA1 cells were injected s.c. into the male athymic mice (n = 5). Dorsal views of bioluminescent (BL) images of representative tumor xenografts at days 6, 16, and 23 are shown. (B) Quantitative analysis of tumor light emission from day 6 after cancer cell injections until day 23 is shown in Total Flux (photon per sec). *P < 0.05 (two‐way ANOVA). (C) Tumor growth was monitored using a digital caliper once a week starting at day 14. ****P < 0.0001 (two‐way ANOVA). (D) Representative mouse tumor xenografts showing MTA1 depletion effect on tumor growth. (E) H&E‐stained sections (scale bars, 100 μm) and IHC analyses (scale bars, 50 μm) for proliferative activity (Ki67) in tumor tissues from PC3M‐Luc‐NS and PC3M‐Luc‐shMTA1 xenografts. (F) Quantitation of proliferative index in five randomly selected fields for each tissue. Data represent the mean ± SEM of five fields from five mice. ****P < 0.0001 (unpaired t‐test).
