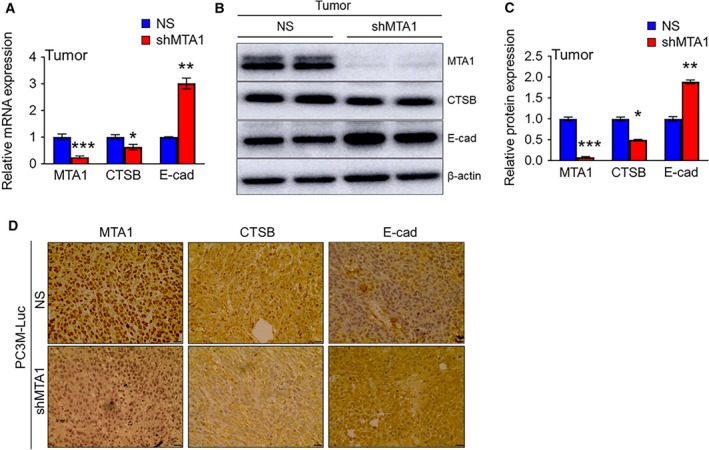
Figure 5.

MTA1 knockdown reduces cathepsin B mRNA and protein levels in s.c. tumor tissues. (A) qRT‐PCR of MTA1, CTSB, and E‐cad mRNA levels in the tumor tissues from s.c. xenografts. (B) Immunoblots of MTA1, CTSB, and E‐cad in the tumor tissues from s.c. xenografts. β‐Actin was used as a loading control. (C) Quantitation of immunoblot. Data represent the mean ± SEM of three independent experiments from n = 3 for qRT‐PCR and n = 2 for immunoblot analysis. *P < 0.05; **P < 0.01; ***P < 0.001 (two‐way ANOVA). (D) Comparison of nuclear MTA1 and cytoplasmic CTSB and membrane‐bound E‐cad IHC staining in the tumor tissues from PC3M‐Luc‐NS and PC3M‐Luc‐shMTA1 xenografts. Scale bars, 10 μm.
