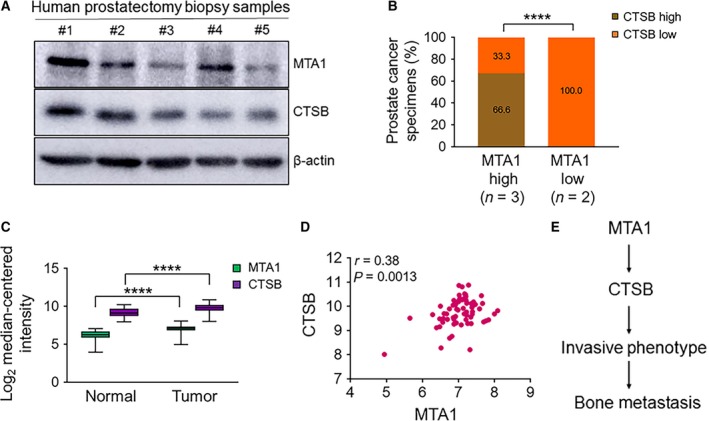
Figure 6.

MTA1/CTSB axis in human prostate cancer. (A) Immunoblot analysis for MTA1 and CTSB protein levels in five representative patients. (B) Distribution of MTA1 and CTSB expression in the cohort of patients with prostate cancer analyzed in (A). ****P < 0.0001 (chi square test). (C) Meta‐analysis showing MTA1 and CTSB mRNA overexpression in prostate tumor samples compared to normal tissues from expression array (Wallace et al., 2008) using the Oncomine database. ****P < 0.0001 (two‐way ANOVA). (D) Meta‐analysis of MTA1 and CTSB mRNA expression showing a strong positive correlation in prostate tumor samples from expression array (Wallace et al., 2008) using the Oncomine database. (E) Schematic of the proposed MTA1‐mediated cathepsin B involvement in prostate cancer metastasis to the bone.
