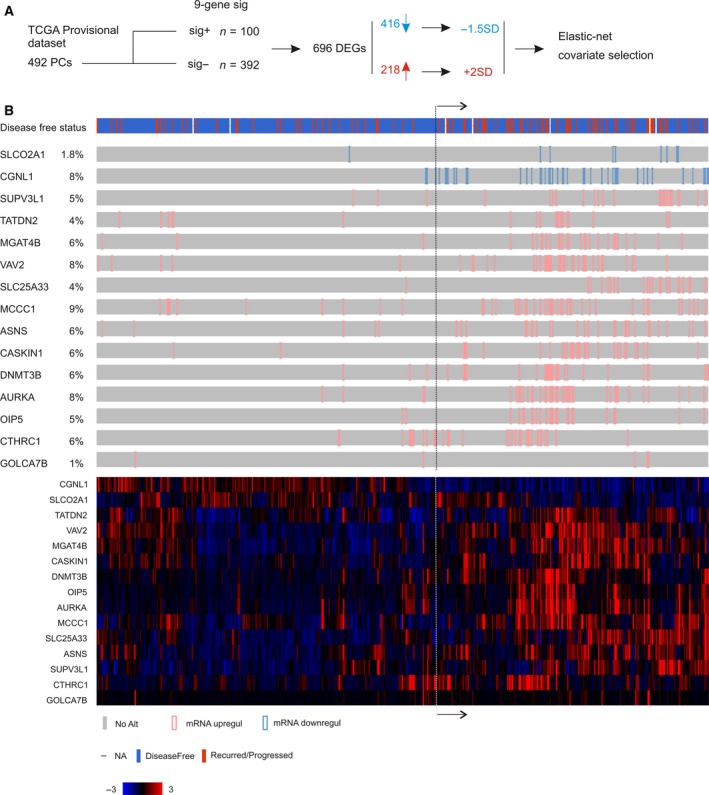
Figure 1.

Construction of a 15‐gene signature. (A) Strategy used to produce the signature. The TCGA Provisional dataset within cBioPortal has 492 prostate cancers with gene expression profiled by RNA sequencing. The cohort was first divided into two populations: one (n = 100) positive for a 9‐gene signature derived from a MUC1 genomic network (Lin et al., 2017) and another (n = 392) negative for the signature. From these two populations, 696 differentially expressed genes (DEGs) were identified based on the mean mRNA expression and q < 0.001. These DEGs consist of 461 downregulated genes and 218 upregulated genes. For the downregulated genes, we have assigned tumors with gene expression at 1.5 SD (standard deviation) lower than a reference population mean (−1.5 SD); for those upregulated genes, we have located PCs with these gene expression at 2 SD above the population mean. We then performed model‐building using regularization‐coupled covariate selection of these 696 DEGs for their impact on BCR using the Elastic‐net penalty in the R glmnet package (Fig S1 for a typical selection), which resulted in a 15‐gene signature (SigMuc1NW). (B) PCs of the TCGA cohort with −1.5 SD (SLCP2A1 and CGNL1) and 2 SD expression are shown using OncoPrint (top gray illustration) and clustered (bottom color image). The disease‐free status is also included. The illustration was generated using tools provided by cBioPortal.
