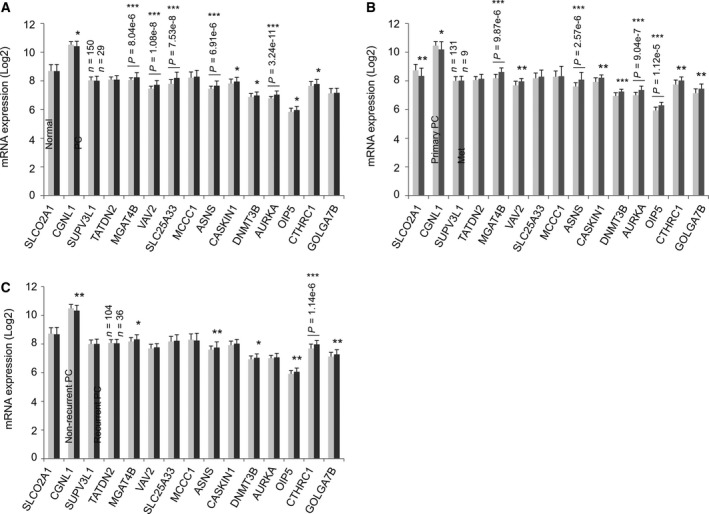
Figure 6.

Alterations in the expression of the component genes in an independent PC population. Gene expression data determined by microarray were extracted from the MSKCC dataset (Robinson et al., 2015) within cBioPortal. The mRNA levels in normal and PC tissues (A), in primary PC and metastatic PC (B), and in nonrecurrent and recurrent PC (C) were determined. The number of cases used in the comparisons is indicated. Means ± SD are graphed. Statistical analyses were performed using Student's t‐test (2‐tailed). *P < 0.05, **P < 0.01, and ***P < 0.001.
