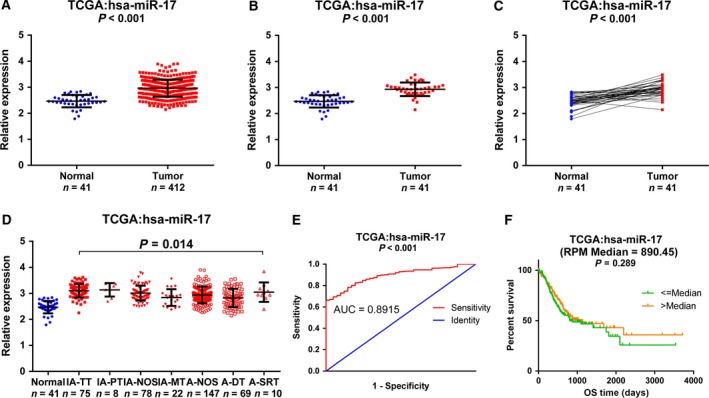
Figure 4.

MiR‐17 expression in GC in TCGA database. The expression of miR‐17 in TCGA data was normalized using the logarithm. (A) Comparison of miR‐17 levels in 412 GC tissues and 41 normal gastric mucosal tissues in TCGA data. (B,C) Comparison of miR‐17 levels in 41 pairs of GC tissues and adjacent non‐tumor tissues. (D) Comparison of miR‐17 levels in different histological types of GC tissues. (E) The ROC curve of miR‐17 expression based on TCGA data (AUC = 0.857, 95% CI: 0.808–0.905, P < 0.001). (F) Kaplan–Meier survival curves of miR‐17. A‐DT, adenocarcinoma diffuse type; A‐NOS, adenocarcinoma not otherwise specified; A‐SRT, adenocarcinoma signet ring Type; AUC, area under the curve; IA‐MT, intestinal adenocarcinoma mucinous type; IA‐NOS, intestinal adenocarcinoma not otherwise specified; IA‐PT, intestinal adenocarcinoma papillary type; IA‐TT, intestinal adenocarcinoma tubular type; OS, overall survival.
