
Figure 1.
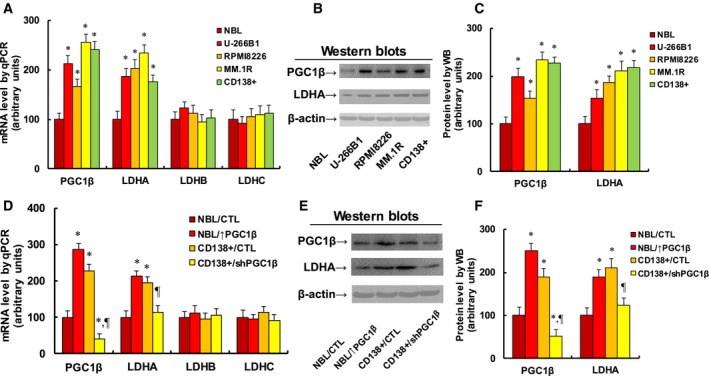
Increased LDHA expression in multiple myeloma cells is regulated by PGC1β. (A–C) Different cells, including isolated normal B lymphocytes (NBL), CD138‐positive multiple myeloma cells (CD138+), and multiple myeloma cells lines U266B1, RPMI8226, and MM.1R, were used for gene analysis. (A) mRNA level by qPCR, n = 4. (B) Representative pictures for western blotting. (C) Quantitation of protein levels for (B), n = 5. *P < 0.05, vs NBL group. (D–F) The NBL cells were infected by PGC1β lentivirus (↑PGC1β), the CD138+ MM cells were knocked down by PGC1β (shPGC1β) lentivirus, and the cells were used for gene analysis. (D) mRNA level by qPCR, n = 4. (E) Representative pictures for western blotting. (F) Quantitation of protein levels for (E), n = 5. *P < 0.05, vs NBL group; ¶ P < 0.05 vs CD138+/CTL group. Data are expressed as mean ± SEM, and the group differences were statistically significant by one‐way ANOVA.