
Figure 2.
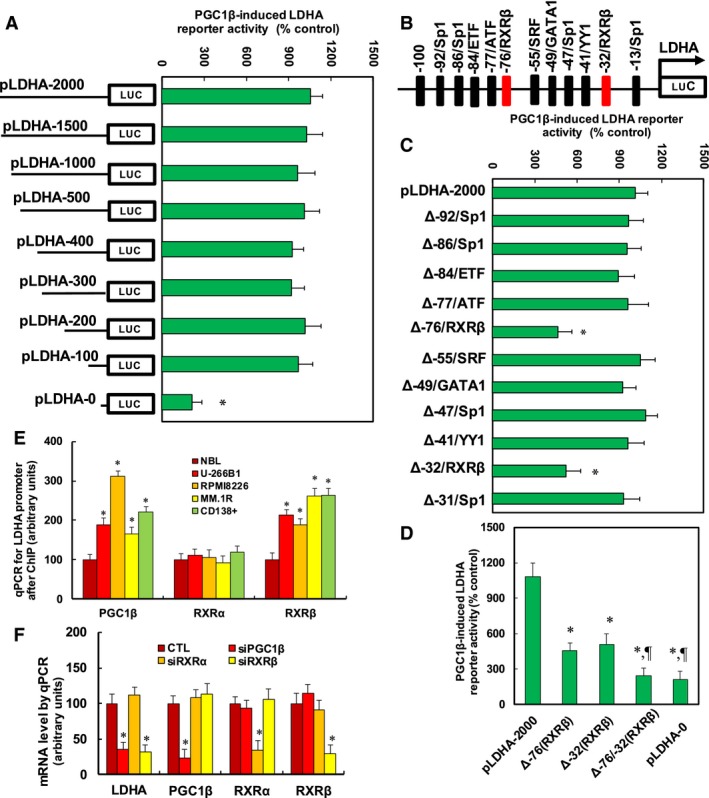
PGC1β regulates LDHA expression through PGC1β‐mediated increased RXRβ binding ability on the LDHA promoter. (A) The MM.1R cells were infected by either PGC1β (↑PGC1β) or empty control (CTL) lentivirus for 2 days, and then, cells were transiently transfected by either LDHA full‐length (pLDHA‐2000) or deletion reporter plasmids. After 24 h, the PGC1β‐induced LDHA reporter activities from PGC1β lentivirus‐infected cells (↑PGC1β) were calculated as the relative percentage (% control) by comparing to lentivirus empty control (CTL)‐infected cells. *P < 0.05, vs pLDHA‐2000 group, n = 4. (B) The schematic picture for the potential transcriptional binding motif in the range of −100~0 (from transcription start site) on the LDHA promoter, and the two potential RXRβ binding sites are marked with red color. (C) The lentivirus‐infected MM.1R cells were transiently transfected by either LDHA full‐length (pLDHA‐2000) or the specific transcriptional binding motif deletion reporter plasmids, and then, after 24 h, the reporter activities were measured. *P < 0.05, vs pLDHA‐2000 group, n = 4. (D) The lentivirus‐infected MM.1R cells were transiently transfected by either LDHA full‐length reporter (pLDHA‐2000), RXRβ deletion plasmids of either Δ‐76, Δ‐32, or both Δ‐76/‐32, or full‐length truncate reporter (pLDHA‐0) plasmids, and after 24 h, the reporter activities were measured. *P < 0.05, vs pLDHA‐2000 group; ¶ P < 0.05, vs Δ‐76(RXRβ) group, n = 4. (E) Different MM cells were used for ChIP analysis by PGC1β, RXRα, or RXRβ antibody, respectively, and the LDHA promoter in the range of −200~0 was amplified and measured by qPCR, n = 5. *P < 0.05, vs NBL group. (F) The MM.1R cells were transfected by siRNA for either nonsense control (CTL), PGC1β, RXRα, or RXRβ for 2 days, and then, the cells were harvested for mRNA analysis. *P < 0.05, vs CTL group, n = 5. Results are expressed as mean ± SEM, and the group differences were statistically significant by one‐way ANOVA.