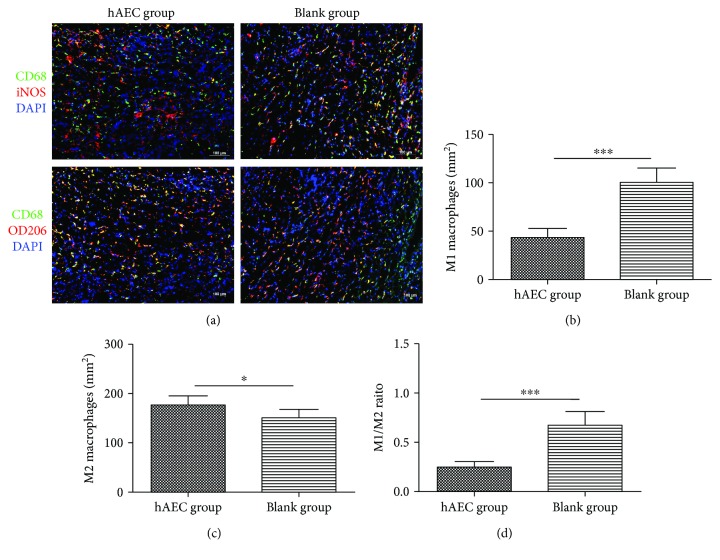
Figure 3.
Macrophage phenotype was polarized toward M2 macrophage in the hAEC-treated group. (a) Representative immunofluorescent staining of M1 and M2 macrophages in day 10 wounds. M1 macrophages were shown in the upper panel to be yellow as CD68+iNOS+DAPI+ triple-positive staining, and M2 macrophages were shown in the lower panel to be yellow as CD68+CD206+DAPI+ triple-positive staining. (b, c, and d) The number of M1 macrophages was significantly reduced in the hAEC group (b), whereas the number of M2 macrophages was increased (c), resulting in a lower M1/M2 ratio (d). Data was shown as means ± SD; n = 6; ∗P < 0.05; ∗∗∗P < 0.001; scale bar = 100 μm.

