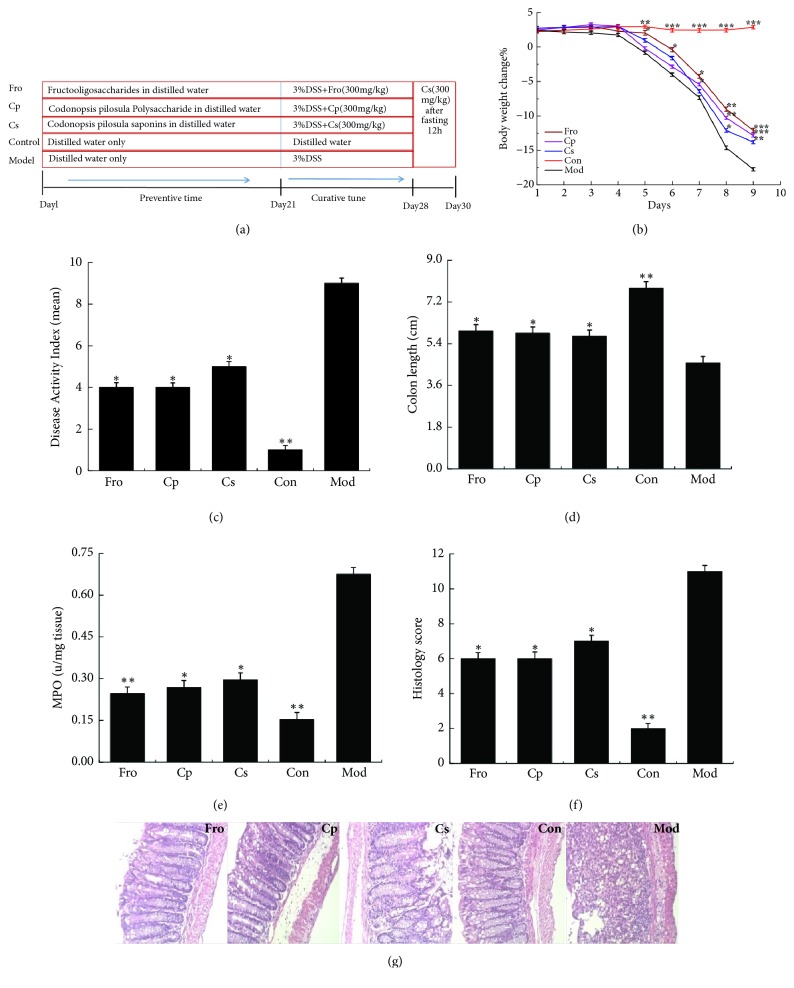
Figure 2.
Role of Codonopsis pilosula extracts in the DSS-induced colitis model in C57BL/6 mice. (a) Experimental process of UC induction by 3% DSS. (b) Body weight change after induction of colitis using 3% DSS. DAI (c), colon length (d), MPO (e), and histology score (f) in each group. (g) Representative H&E-stained colorectal sections (100× magnification) in mice with acute colitis. Histology score based on 10 H&E-stained sections per mouse. ∗P < 0.05; ∗∗P < 0.01; ∗∗∗P < 0.001 versus the DSS-treated group. Data are presented as means ± SD of four mice in each group (b–f, n = 4). Fro = fructooligosaccharides group, Cp = Codonopsis pilosula polysaccharide group, Cs = Codonopsis pilosula saponins group, Con = control group, and Mod = DSS-induced colitis group.

