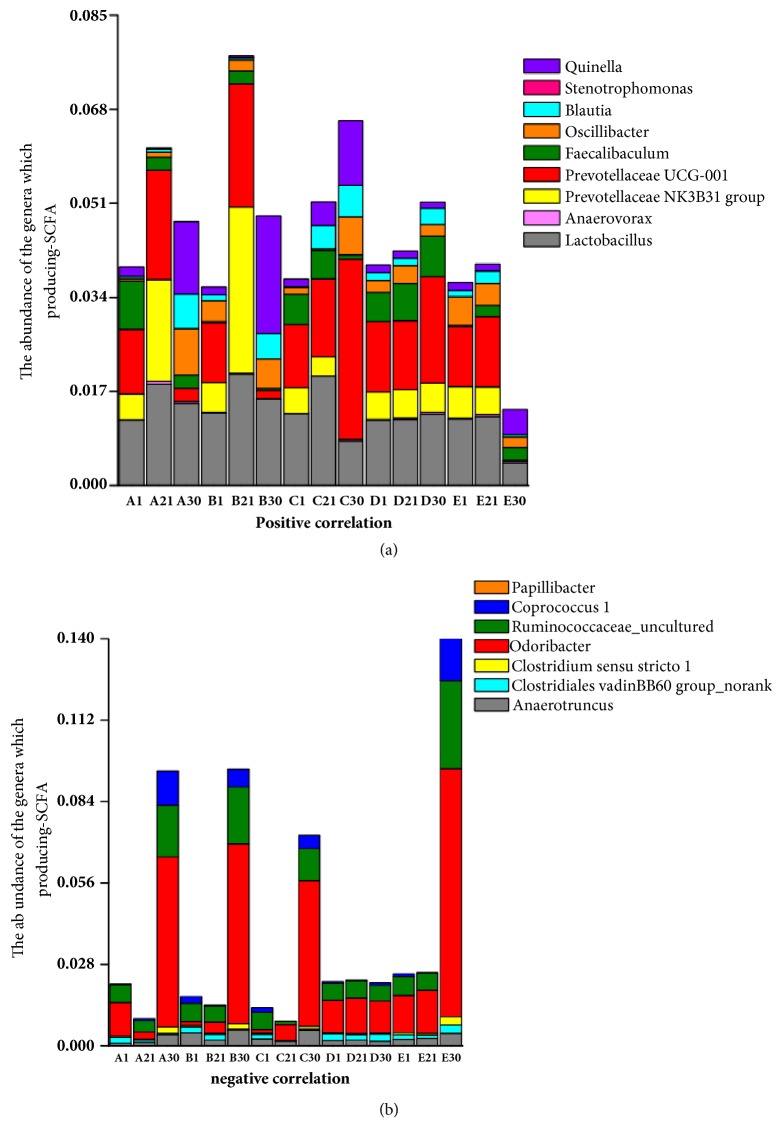
Figure 6.
Correlations between the fecal microbiota and fecal SCFA concentrations after treatment with Codonopsis pilosula extracts. (a) Positive correlation between the abundance of genera and SCFA concentrations. (b) Negative correlation between the abundance of genera and SCFA concentrations. Fro = fructooligosaccharides group, Cp = Codonopsis pilosula polysaccharide group, Cs = Codonopsis pilosula saponins group, Con = control group, and Mod = DSS-induced colitis group.

