Figure 3.

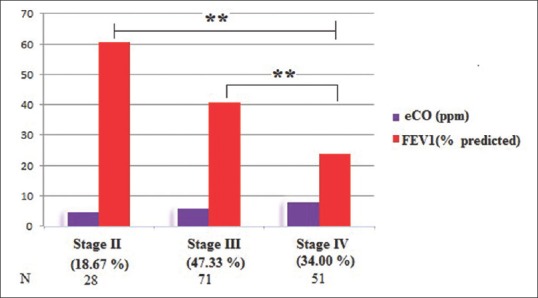
Comparison of exhaled carbon monoxide and forced expiratory volume in 1 s in different stages of chronic obstruction pulmonary disease. **Shows significant difference (P < 0.05)

Comparison of exhaled carbon monoxide and forced expiratory volume in 1 s in different stages of chronic obstruction pulmonary disease. **Shows significant difference (P < 0.05)