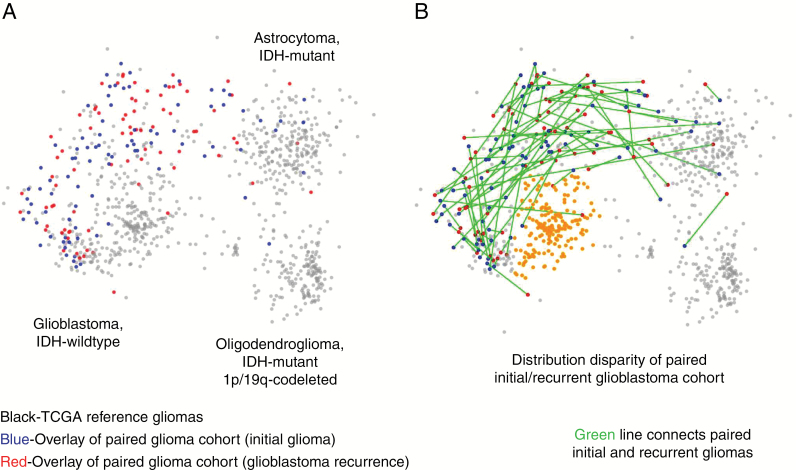
Fig. 3.
Exome sequencing added to copy number highlights molecular signature of additional poor prognostic group. (A) Multidimensional scaling (MDS) analysis based on whole exome sequencing and copy number alterations shows that mapping of the paired initial/recurrent glioblastoma cohort has uneven spatial distribution when overlaid on the reference dataset of TCGA (TCGA cohort = gray; paired initial glioma = blue; paired recurrent glioma = red). (B) Green edges show the connections of individual paired initial and recurrent gliomas. Orange-colored region highlights tightly clustered area of which 51% of TCGA glioblastomas exist, but only one initial glioma from the paired initial/recurrent glioblastoma dataset.

