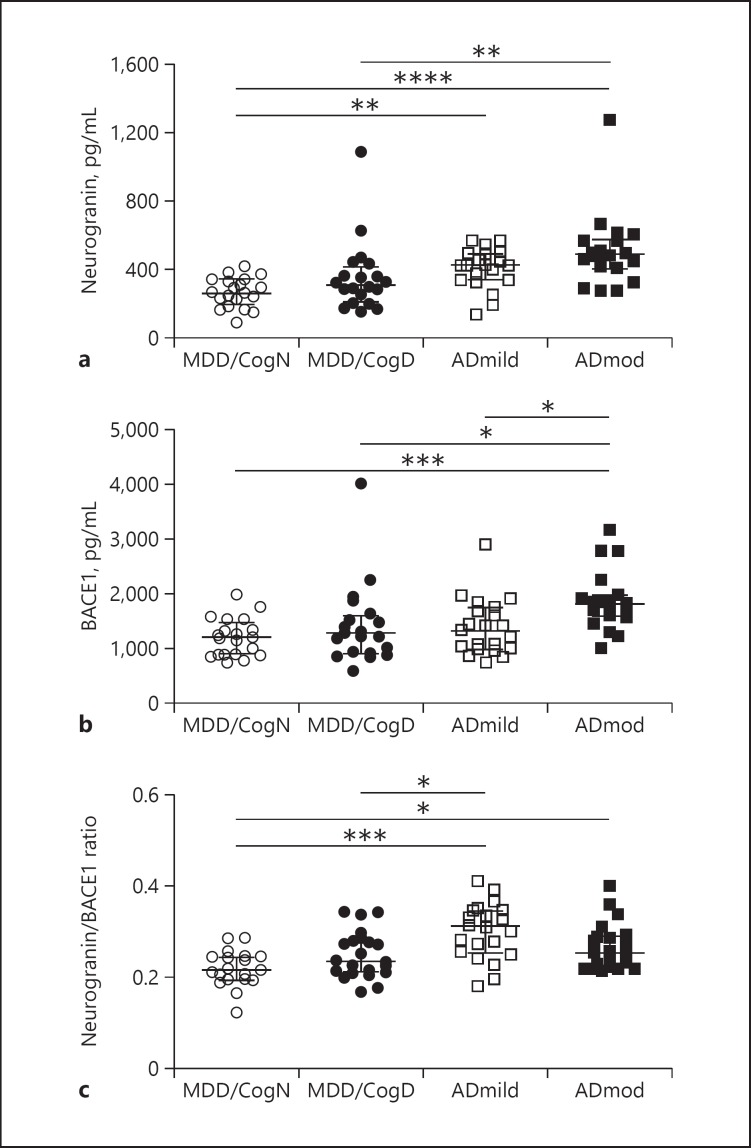
Fig. 1.
Scatter dot plots demonstrating CSF concentrations of neurogranin (a) and BACE1 (b) and the neurogranin/BACE1 ratio in CSF (c). Median levels are depicted as lines in each plot; bars represent the interquartile range. Statistically significant differences: * p < 0.05, ** p < 0.01, *** p < 0.001, **** p < 0.0001. MDD/CogN, depression without cognitive deficits; MDD/CogD, depression with cognitive deficits; ADmild, mild Alzheimer's disease; ADmod, moderate Alzheimer's disease.

