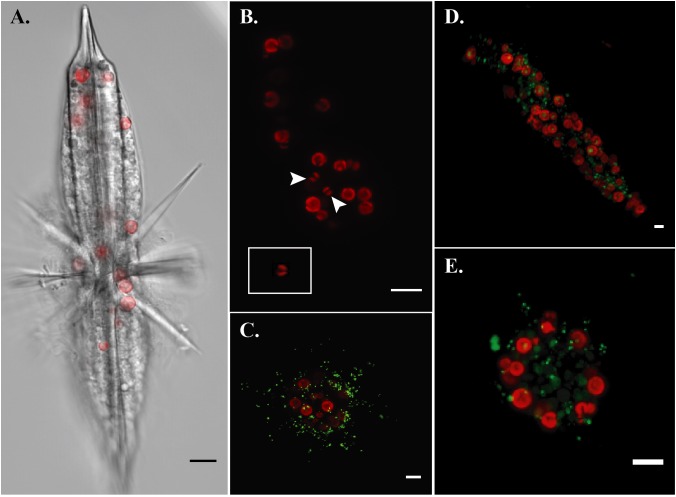
FIGURE 6.
Fluorescent confocal microscopy of acantharians and their symbionts. (A) Single optical slice displaying autofluorescence of symbiont chlorophyll (red) and halogen light imaging of an entire host, sample Oki.3A. (B) Maximum projection of a z-stack spanning the entire host sample Oki.4A, which contains 17 visible symbionts and 10 symbiotic sequence variants. Arrows indicate symbionts presenting the free-living phenotype: smaller cell diameter and two elongate, parietal chloroplasts, which is also visible in the inset image of a Phaeocystis globosa CCMP1528 cell in culture that was imaged following the same methods. Red fluorescence is chlorophyll autofluorescence. (C–E) Maximum projections of z-stacks spanning entire hosts collected near Okinawa in December 2017. Red fluorescence is symbiotic chlorophyll autofluorescence. Green fluorescent staining is LysoTracker Green, which selectively binds to low-pH digestive-organelles, including lysosomes and phagolysosomes. Symbionts are not held in phagolysosomes and lysosomes are not concentrated around symbionts, indicating that symbionts are not actively being digested. Scale bars are 10 μm in all panels.

