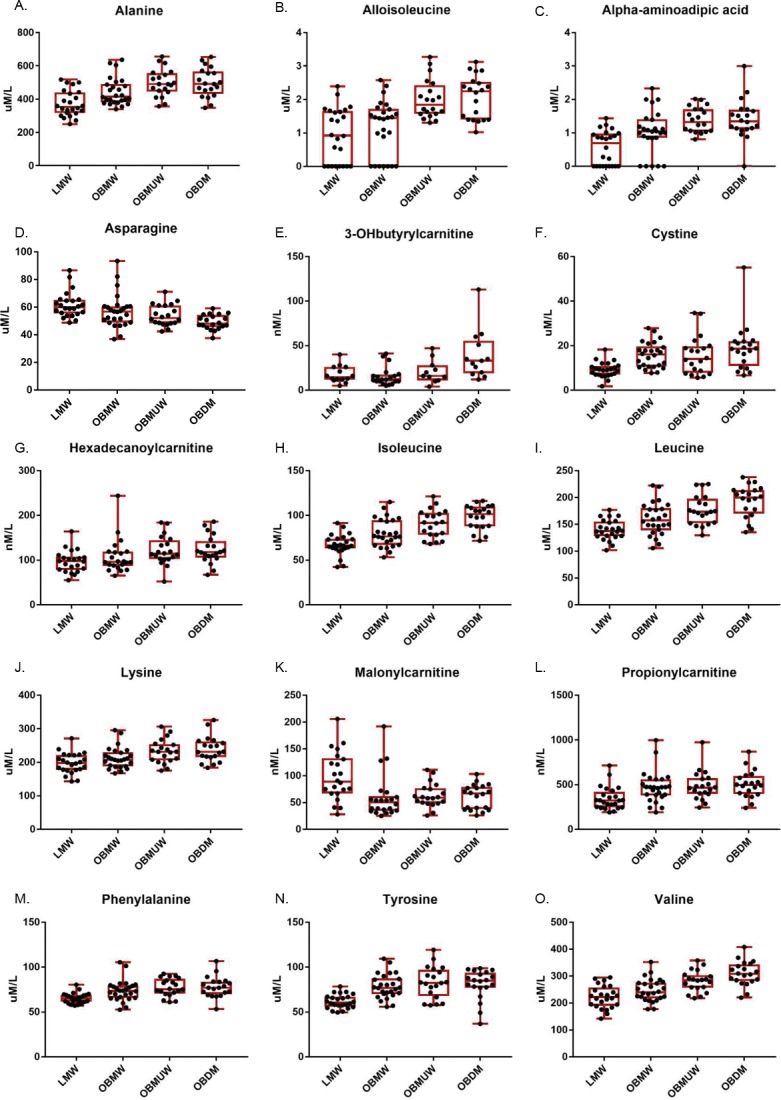
Figure 1. Box and whisker plots of plasma amino acid and acylcarnitine species with significant group differences (Kruskal-Wallis test, p < 0.005).

The subject number in each group was as follows: LMW = 24, OBMW = 26, OBMUW = 20, OBDM = 20 except in the case of 3-OHbutyrylcarnitine, which was specifically quantified in 58 subjects (LMW = 14, OBMW = 20, OBMUW = 11, OBDM = 13). The species quantified in the other subjects could be either 3-OHisobutyrylcarnitine or 3-OHbutyrylcarnitine. Acylcarnitine levels are reported as nanomoles/liter, except for free carnitine and acetylcarnitine that are reported as micromoles/liter.
