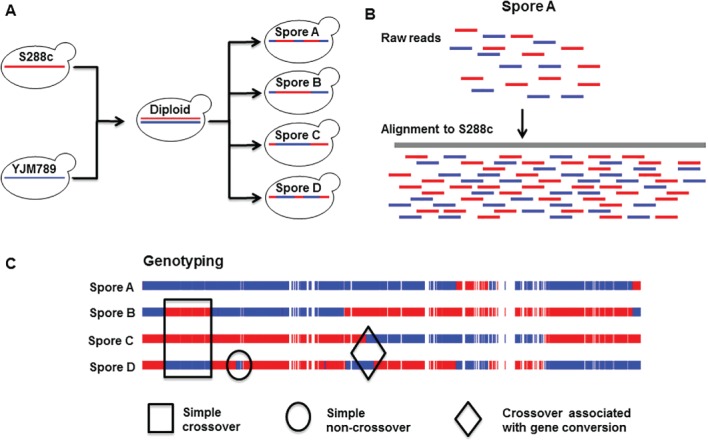
Figure 2.

Recombination mapping using NGS analysis of hybrid yeast strains. (A) Representative cross involving the S. cerevisiae S288c and YJM789 strains to generate hybrid diploid. The diploid is sporulated and the spores are sequenced using NGS methods. (B) Alignment of whole genome sequence data from spores to a reference genome for calling variants (SNPs). (C) Recombination outcomes that may be detected from SNP segregation data in the four spores from a single tetrad. Rectangular box shows simple crossovers that can be identified by the reciprocal exchange of flanking markers in 2:2 segregation pattern. Diamond box shows crossovers accompanied by gene conversions with the segregation of markers in 1:3 or 3:1 ratio around the exchange sites. Circle shows simple non‐crossovers which can be detected by the presence of 1:3 or 3:1 segregation tracts without any exchange of flanking markers. In addition minority recombination outcomes caused by events like multiple chromatid invasions or exchanges involving more than two chromatids can also be detected by marker segregation patterns containing signatures unique to the mechanism.
