
Figure 3.
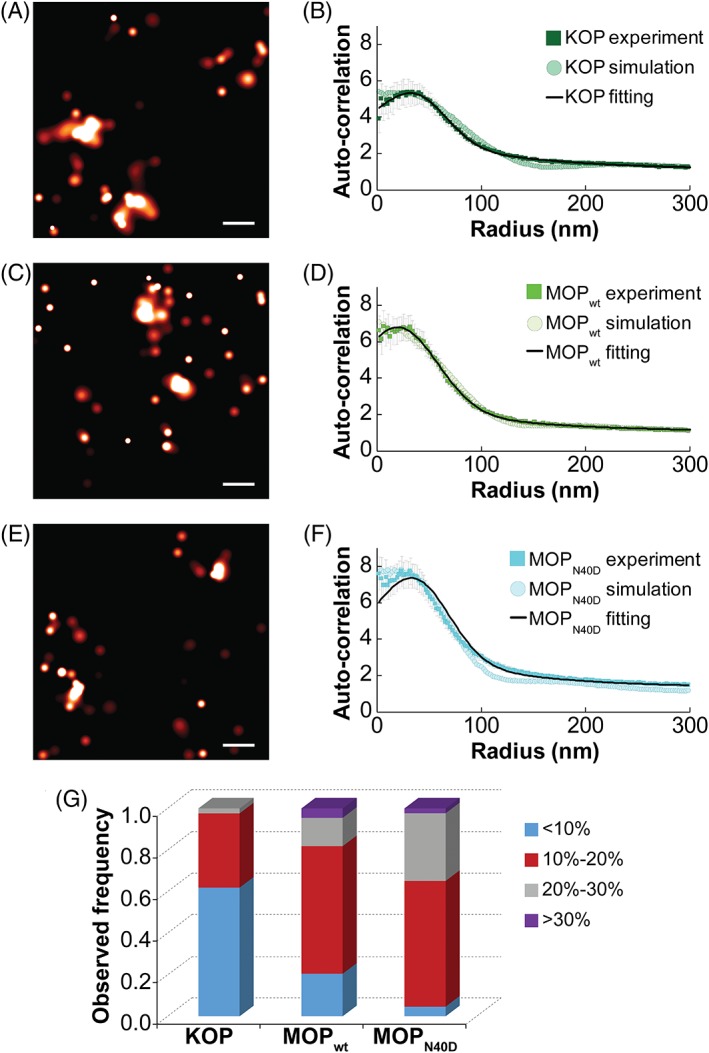
Opioid receptors differ in their spatial organization at the nanoscale level. (A) PALM image of KOP‐paGFP from a region on a single COS‐7 cell (scale bar, 100 nm). (B) The average KOP‐paGFP auto‐correlation function obtained from experimental data (dark green squares; 14 cells, N = 42) and simulation (dark green circles); the fitting curve is also shown (black line). (C) PALM image of MOPwt‐paGFP from a region on a single COS‐7 cell (scale bar = 100 nm). (D) The average MOPwt‐paGFP auto‐correlation function obtained from experimental data (green squares; 14 cells, N = 44) and simulation (green circles). The fitting curve is also shown (black line). (E) PALM image of MOPN40D‐paGFP from a region on a single COS‐7 cell (scale bar = 100 nm). (F) The average MOPN40D‐paGFP auto‐correlation function obtained from experimental data (cyan squares; 15 cells, N = 43) and simulation (cyan circles). The fitting curve is also shown (black line). Fitting and simulation results are in agreement for all 3 constructs; the results are summarized in Tables 1 and S2. PALM images were generated by analyzing datasets in PeakSelector12 and grouping peaks within a group radius of 3σ MAX with maximum dark time of 5 seconds. SE bars are shown. (G) For each ROI, we calculated the fraction of receptors that reside outside of nanodomains. We next provided normalized histogram for such molecules: Fraction of ROIs with less than 10% of receptors residing outside nanodomains is in blue; with 10% to 20% in red; with 20% to 30% in gray and with more than 30% in purple. The average values with SEs were 10.0 ± 0.7% (KOP‐paGFP); 15 ± 1% (MOPwt‐paGFP) and 18.1 ± 0.9% (MOPN40D‐paGFP). P‐value between KOP‐paGFP and MOPwt‐paGFP is 4 × 10⁻⁵; P‐value between MOPwt‐paGFP and MOPN40D‐paGFP is .03. Thus, KOP‐paGFP has the smallest and MOPN40D‐paGFP has the largest fraction of receptors that reside outside of nanodomains