
Figure 6.
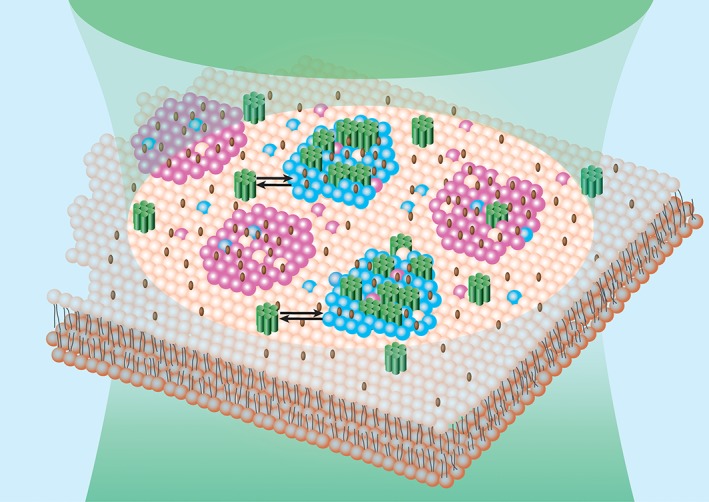
Complex lateral organization of opioid receptors at the nanoscale level. Schematic presentation of dynamic lateral organization of opioid receptors (green cylinders) in the plasma membrane lipid bilayer (pale orange). Magenta regions indicate GM1‐enriched domains from which opioid receptors are largely excluded. Cyan regions indicate domains enriched in cholesterol (brown rods), with which opioid receptors partially associate. Arrows indicate that opioid receptor partitioning between the nanodomains and the lipid bilayer, and their number in each phase is dynamically regulated. In the case of KOP and MOPwt, the fraction of molecules associated with nanoscale domains decreases when the cholesterol content in the plasma membrane is depleted