
Figure 6.
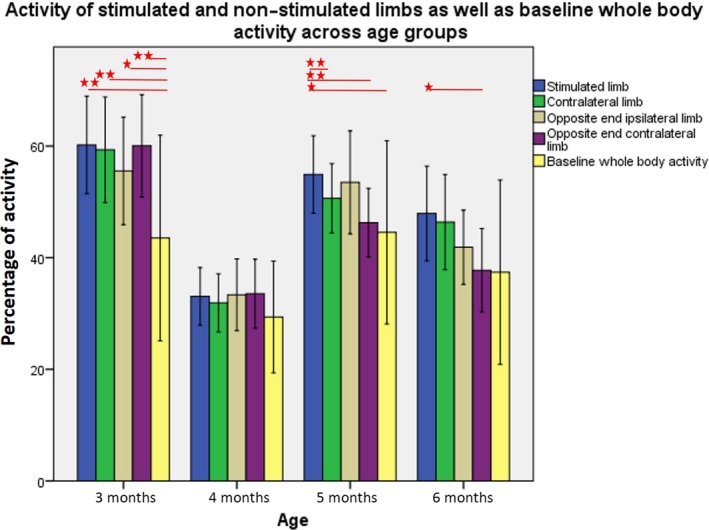
Mean percentage of activity of stimulated limb as compared to the three non‐stimulated limbs and whole body activity at baseline (averaged activity of the four limbs) across age groups. In case of hand stimulations, ‘opposite end limb’ refers to the feet, and in case of foot stimulations, it refers to the hands. Within each age group, significant differences between means are marked with an asterisk (*p < 0.05; ∗∗ p < 0.01), as calculated with pairwise comparisons following the generalized estimating equations (GEE) procedure. [Colour figure can be viewed at http://wileyonlinelibrary.com]