
Figure A1.
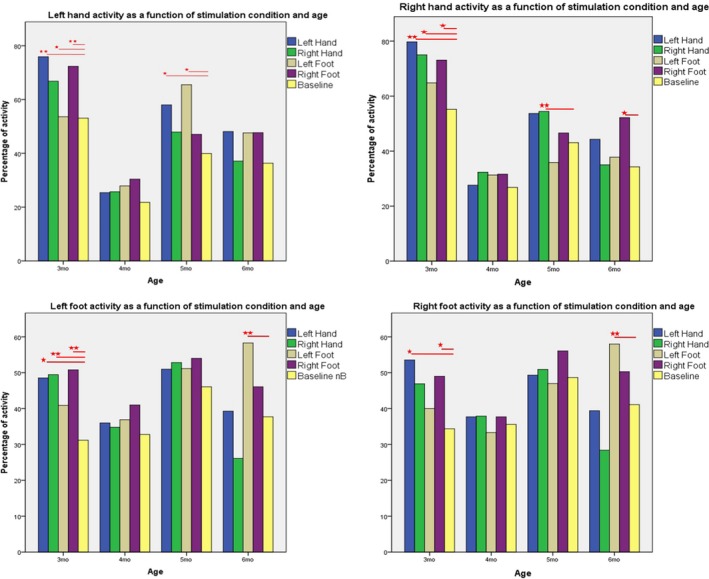
Mean percentage of activity of each limb across stimulation conditions and age groups. Within each age group, significant differences between means are marked with an asterisk (∗ p < 0.05; ∗∗ p < 0.01), as calculated with pairwise comparisons following the generalized estimating equations (GEE) procedure. [Colour figure can be viewed at http://wileyonlinelibrary.com]