Figure 4.

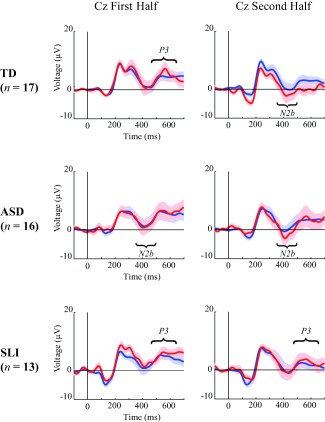
Grand Averages for the first and second half in TD (upper), ASD (middle), and SLI (lower) children, for Cz electrode, with blue and red lines representing standard and deviant trials respectively (shaded areas are SEMs).

Grand Averages for the first and second half in TD (upper), ASD (middle), and SLI (lower) children, for Cz electrode, with blue and red lines representing standard and deviant trials respectively (shaded areas are SEMs).