
Figure 5.
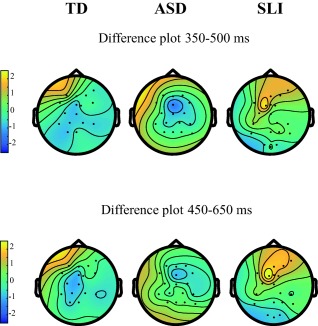
Visualization of the amplitude differences between deviant and standard trials for the N2b time window (upper) and the P3 time window (lower) for the TD (left), ASD (middle), and SLI (right) group. Note the frontal positivity in SLI, compared to the central negativity in TD and ASD.