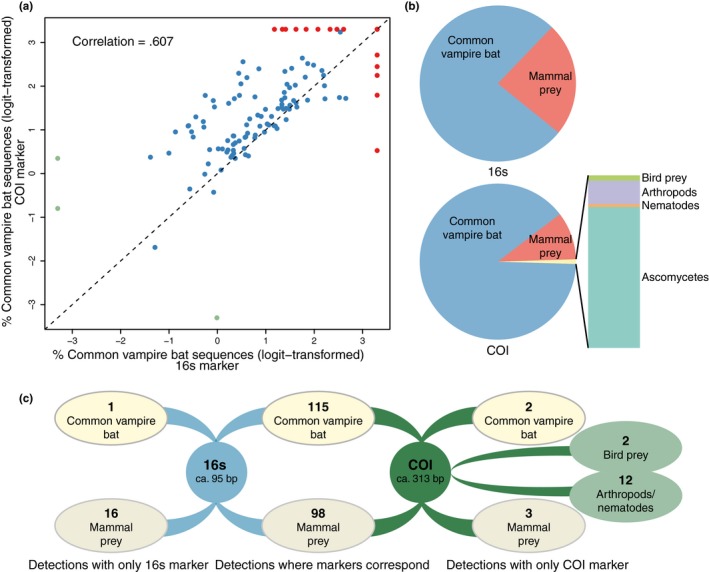
Figure 2.

Performance of two primer sets, mammal 16s and metazoan COI, for common vampire bat diet assessment. (a) Scatter plot of the logit‐transformed percentages of common vampire bat sequences detected with the two primer sets. Each data point represents one common vampire bat bloodmeal or faecal sample (n = 118). The x = y line is shown in dashed black. Data points for samples for which one of the markers had 0% common vampire bat sequences are green. Data points for samples in which one of the markers had 100% common vampire bat sequences are red. The correlation coefficient (r 2) is computed based on nontransformed data. (b) Proportion of sequences assigned to OTUs in different taxonomic categories in the total data set (118 samples). (c) Number of detections of common vampire bat, mammal prey, bird prey and arthropods/nematodes with the two primer sets in 118 faecal and bloodmeal samples
