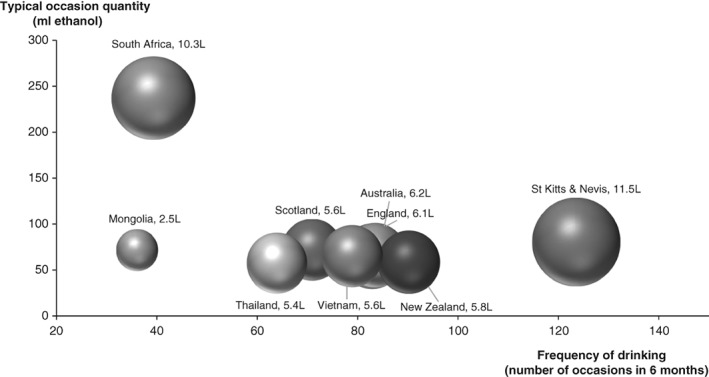
Figure 1.

Bubble plots for alcohol consumption variables in nine International Alcohol Control study countries.
Note: The bubble plots display estimates of three alcohol consumption variables of nine International Alcohol Control study countries in terms of frequency of drinking, typical occasion quantity and total alcohol consumption per drinker. Size of bubble plots refers to total alcohol consumption per drinker (litre of ethanol). Australia's and England's estimates are very similar; their plots are almost overlapping.
