

Abstract
Background
Prognostic biomarkers for localized prostate cancer (PCa) could improve personalized medicine. Our group previously identified a panel of differentially methylated CpGs in primary tumor tissue that predict disease aggressiveness, and here we further validate these biomarkers.
Methods
Pyrosequencing was used to assess CpG methylation of eight biomarkers previously identified using the HumanMethylation450 array; CpGs with strongly correlated (r >0.70) results were considered technically validated. Logistic regression incorporating the validated CpGs and Gleason sum was used to define and lock a final model to stratify men with metastatic‐lethal versus non‐recurrent PCa in a training dataset. Coefficients from the final model were then used to construct a DNA methylation score, which was evaluated by logistic regression and Receiver Operating Characteristic (ROC) curve analyses in an independent testing dataset.
Results
Five CpGs were technically validated and all were retained (P < 0.05) in the final model. The 5‐CpG and Gleason sum coefficients were used to calculate a methylation score, which was higher in men with metastatic‐lethal progression (P = 6.8 × 10⁻⁶) in the testing dataset. For each unit increase in the score there was a four‐fold increase in risk of metastatic‐lethal events (odds ratio, OR = 4.0, 95%CI = 1.8–14.3). At 95% specificity, sensitivity was 74% for the score compared to 53% for Gleason sum alone. The score demonstrated better prediction performance (AUC = 0.91; pAUC = 0.037) compared to Gleason sum alone (AUC = 0.87; pAUC = 0.025).
Conclusions
The DNA methylation score improved upon Gleason sum for predicting metastatic‐lethal progression and holds promise for risk stratification of men with aggressive tumors. This prognostic score warrants further evaluation as a tool for improving patient outcomes.
Keywords: biomarker validation, DNA methylation score, metastatic‐lethal, prognostic, prostate cancer
1. BACKGROUND
Prostate cancer (PCa) is responsible for more than 26 000 deaths each year, and men initially diagnosed with clinically localized disease comprise a substantial proportion of this mortality.1 Recent estimates indicate that over 80% of patients have tumors confined to the prostate at first presentation,2, 3, 4 and of those treated with radical prostatectomy many will have a durable cure.5, 6 However, a subset of surgically treated patients will develop biochemical recurrence and some will progress to metastatic, life‐threatening PCa.6, 7 Genomic biomarkers with prognostic value for stratifying patients at high risk for metastatic progression and disease‐specific mortality are needed to advance personalized medicine.8, 9
Molecular studies of tumor tissue have led to development of commercial tests based on gene expression scores for prediction of metastasis or PCa death after prostatectomy, with AUC values ranging from 0.75 to 0.82 for these mRNA‐based assays.8, 9, 10, 11 However, rigorous comparative effectiveness studies of these assays and prospective clinical studies are needed to confirm the performance characteristics of these tests. In addition, there are other fluid‐based12 and tumor tissue‐based13, 14 biomarker panels that may aid risk stratification of men diagnosed with localized disease, but these also require further evaluation.
Alterations in DNA methylation may occur early in tumorigenesis, are the most recurrent events in metastatic PCa, and can impact gene expression.15, 16 We hypothesize that the DNA methylation profile of a primary prostate tumor may reveal its aggressiveness potential, and because the stability of tumor DNA exceeds that of RNA, DNA‐based biomarkers may prove to be more reliable. Indeed, a recent study found that the performance characteristics of DNA methylation‐based biomarkers were superior to expression‐based ones for detecting cancer in prostate biopsy tissue.17
We previously used primary tumor tissue‐derived DNA samples to develop a panel of eight differentially methylated CpGs that improved upon Gleason sum for classifying post‐prostatectomy patients who experienced metastatic‐lethal progression as compared to their counterparts who remained recurrence‐free for at least 5 years following surgery. The panel of eight CpG sites was initially identified using epigenome‐wide data from a training cohort and was validated in an independent dataset, with AUC values for individual CpGs in combination with Gleason sum ranging from 0.82 to 0.89 for prediction of metastatic‐lethal outcomes.13 To further investigate the potential clinical utility of these DNA methylation biomarkers, we first performed pyrosequencing for technical validation of each CpG, created a methylation score based on Gleason sum and the CpGs that were technically validated and were retained in the final locked model, and then evaluated the score's performance in an independent testing dataset.
2. METHODS
2.1. Study populations
2.1.1. Training dataset
Two independent study populations diagnosed with localized adenocarcinoma of the prostate and treated with radical prostatectomy were combined as a training dataset: 1) a Fred Hutchinson (FH) Cancer Research Center‐based cohort; and 2) an Eastern Virginia (EV) Medical School‐based nested case‐control dataset. These populations were described previously.13 Briefly, the FH cohort includes 344 Caucasian patients ascertained through the Seattle‐Puget Sound SEER cancer registry for population‐based studies of PCa. These men were aged 35‐74 years when diagnosed in January 1993‐December 1996,18 or in January 2002‐December 2005.19 Clinical data, vital status, and underlying cause of death were obtained from the SEER registry. Cause of death was verified by review of death certificates. PCa recurrence status was determined from follow‐up surveys, review of medical records, and contact with physicians’ offices. Metastatic progression was confirmed by a positive bone scan, MRI, CT, or biopsy. Over an average 8‐year follow‐up period, 317 patients remained recurrence‐free and 27 had metastatic‐lethal progression. The EV study population comprises 80 Caucasian patients diagnosed in 1992‐2009, including 31 men who developed metastasis or died of PCa and 49 who had no evidence of recurrence during 5 or more years of follow‐up after surgery. Clinical data were extracted from medical records and the EV urological patient database. Metastatic‐lethal events were identified as described for the FH cohort. The combined training dataset included 366 men with no evidence of recurrence and 58 who developed metastasis or died of PCa. The FH and EV Institutional Review Boards approved the study and all patients signed informed consents.
2.1.2. Testing dataset
An independent group of Caucasian PCa patients who underwent radical prostatectomy at the University of Michigan (UM) was utilized as a testing dataset. Based on a nested case‐control design, men diagnosed in 1994‐2005 who subsequently developed metastatic‐lethal PCa (N = 29) were selected as cases from the UM SPORE radical prostatectomy database of patients treated and followed at UM. A similar number of men diagnosed during the same time period and who remained recurrence‐free for at least 5 years post‐surgery (N = 29) was randomly selected as a comparison group. Metastatic progression was confirmed by a positive bone scan, CT, MRI, or biopsy. Disease‐specific deaths were verified by medical records. Clinical data on PSA at diagnosis, Gleason sum, pathologic stage, and outcomes were obtained from the UM SPORE radical prostatectomy database.
2.2. Tumor tissue preparation and DNA methylation profiling
Formalin‐fixed paraffin‐embedded tumor tissue blocks were obtained from radical prostatectomy specimens and used to make hematoxalin and eosin (H & E) stained slides, which were reviewed by pathologists to confirm the presence and location of adenocarcinoma. For the FH and EV patients, two 1‐mm tumor tissue cores from the dominant lesion that were enriched with ≥75% tumor cells were taken for DNA purification. The RecoverAll Total Nucleic Acid Isolation Kit (Ambion/Applied Biosciences, Austin, TX) was used to extract DNA.
For the UM patients, five unstained slides (5‐μm thickness) from prostatectomy FFPE blocks were used to macrodissect tumor tissue from areas marked by an experienced genitourinary pathologist on the corresponding H & E stained slides. DNA was extracted using an automated QIAsymphony SP Extractor with the QIAsymphony DNA Mini Kit (Qiagen, Germantown, MD) with software version 3.5, including deparaffinization, cell lysis using protease K digest, and nucleic acid purification with magnetic beads. DNA yields ranged from 0.5 to greater than 1.0 μg with A260:A280 ratios of 1.8‐2.0. All tumor DNA samples were then quantified using PicoGreen and sent to Illumina (Illumina, Inc., San Diego, CA) for methylation profiling.
The EZ DNA Methylation Kit (Zymo Research, Irvine, CA) was used to bisulfite convert tumor DNA samples. Controls (n = 600) on the array were used to track the bisulfite conversion efficiency. The Infinium® HumanMethylation450 (HM450) BeadChip array (Illumina) was used to measure epigenome‐wide methylation using beads with target‐specific probes designed to interrogate individual CpG sites (>485 000).20 All samples from the FH and EV patients were assayed using the HM450 array as previously described.13 The UM samples were assayed in a single batch using the HM450 array. PCa outcome events were randomly distributed across the plate, laboratory personnel were blinded to clinical information and the location of samples, and the same laboratory technician performed all the methylation assays.
Failed samples were identified by using the detection P‐value metric (probability of a CpG being detected above the background level defined by negative control probes) according to Illumina protocols. A sample was excluded if less than 95% of the CpG sites for that sample on the HM450 array were detected with a detection P‐value <0.05. The final number of patients in the training dataset was 392 (344 non‐recurrent, 48 metastatic‐lethal) and in the testing dataset was 34 (11 non‐recurrent, 23 metastatic‐lethal). Further, CpG sites with a detection P‐value of >0.01 were excluded. After data filtering, 477 460 CpGs were available in each of the FH, EV, and UM datasets.
2.3. Pyrosequencing technical validation
The panel of eight differentially methylated CpGs previously shown to have prognostic value based on HM450 array data13 were evaluated in 36 matched tumor DNA samples (18 FH, 18 EV) by pyrosequencing‐based assays. Each DNA sample (160 ng) was bisulfite converted using the EZ DNA Methylation Kit (Zymo Research) and eluted in 20 μL volume for pyrosequencing. For each pyrosequencing assay, primers, and probes targeting sequences surrounding the specific CpG dinucleotide identified on the array were designed with the PyroMark Primer Assay Design 2.0 software (Qiagen) (Supplementary Table SI). The PCR amplification step was performed using the Qiagen PyroMark PCR kit (Qiagen) following the manufacturer's instructions. The optimal annealing temperatures were determined by temperature gradient PCR with EpiTect 100% methylated and unmethylated control DNA (Qiagen). The PCR samples were submitted to the Genomics Core at the Fred Hutchinson Cancer Research Center to complete the pyrosequencing runs following the manufacturer's instructions (Qiagen). For each pyrosequencing assay, a series of standard DNA samples with known percentages of methylated DNA (0, 20, 40, 60, 80, and 100%) were used as “calibrators” to correct PCR bias by means of cubic polynomial regression before assessing the clinical samples.21 Pyrosequencing values of <0 or >100 were replaced with 0 or 100, respectively. The pyrosequencing assays were run using the matched (ie, the same) tumor DNA aliquots used for the HM450 array in order to assess the accuracy of the array results at each CpG site and to establish pyrosequencing assays for this panel of CpGs that could be used for future clinical testing of these biomarkers.
2.4. Statistical analysis
The HM450 array data for the UM patients were processed using the minfi package in R as previously described for the FH and EV datasets.13 Briefly, the data were normalized using subset‐quantile within array normalization (SWAN).22 Methylation β‐values and M‐values were calculated, where β‐values represent the percentage of DNA methylation at a CpG site, and methylation M‐values are the logit transformed β‐values that are approximately normally distributed. M‐values were used for statistical testing. Genome annotation of the CpGs was based on the Illumina protocol.23
Pyrosequencing assays were designed for technical validation of eight CpGs previously shown to stratify metastatic‐lethal versus non‐recurrent PCa patients.13 Candidate CpGs were retained for further analysis if the pyrosequencing results were strongly correlated (ie, Pearson correlation r > 0.70) with those obtained from the HM450 array for a set of matched primary tumor DNA samples.
A combination rule was formulated based on the technically validated CpGs and Gleason sum for predicting metastatic‐lethal progression. We performed forward model selection with logistic regression using the combined FH and EV dataset, forcing both Gleason sum and study site covariates in the model. Study site was included to account for potential confounding due to the different study designs (FH, cohort; EV, nested case‐control). At each iteration, a CpG was added to the model (one CpG at a time) and a likelihood ratio test was performed to compare the model including the single additional CpG with the model from the previous step. The CpG with the lowest P‐value was added at each iteration until none of the remaining CpGs was statistically significant (ie, P‐value >0.05).
We then tested this final locked model in the UM dataset, where we used the CpG and Gleason sum coefficients to calculate a methylation score for each UM patient. To explore the relationship between the methylation score and outcomes in the testing dataset, we stratified on patient status and then performed a t‐test on the mean methylation score. Further analyses involved fitting a logistic regression model to estimate the relative risk of metastasis or death, with the methylation score entered into the model as a continuous variable. The odds ratio and 95% confidence interval was calculated. Age at diagnosis, year of diagnosis, diagnostic PSA level, and pathologic stage of disease were considered as potential confounders in the regression and prediction models.
A Receiver Operating Characteristic (ROC) analysis was performed to evaluate the ability of the methylation score to distinguish patients with metastatic‐lethal progression from those who remained recurrence‐free. The area under the curve (AUC), partial area under the curve (pAUC), and sensitivity at 95% specificity were computed for the score and for Gleason sum alone. For the analysis, Gleason sum was first categorized as an ordinal variable, which was then treated as a continuous variable in the AUC model. The prediction models also considered the potential effects of age at diagnosis, year of diagnosis, study site, PSA, and stage on results. All analyses were conducted in R (http://cran.r-project.org).
3. RESULTS
Recent epigenome‐wide tumor DNA methylation profiling by our group uncovered eight differentially methylated CpGs that classified radical prostatectomy patients who experienced metastatic‐lethal progression as compared to those who remained recurrence‐free for more than 5 years post‐surgery.13 Five of these eight candidate CpGs were technically validated based on their strong correlation (r > 0.70) with HM450 data using an orthogonal pyrosequencing‐based assay (Table 1). Three CpGs that did not demonstrate a strong correlation between the HM450 array and pyrosequencing results were excluded from further analyses (Supplementary Figure S1).
Table 1.
Correlations between pyrosequencing and HumanMethylation450 array results for eight differentially methylated CpG sites in men with metastatic‐lethal prostate cancer progression a
| CpG | Gene | Pearson correlation |
|---|---|---|
| cg02394978 | FHAD1 | 0.83 |
| cg24349665 | PI15 | 0.82 |
| cg07166550 | ALKBH5 | 0.80 |
| cg16713292 | KLHL8 | 0.78 |
| cg21513610 | ATP11A | 0.76 |
| cg01135464 | Intergenic_chr17 | 0.68 |
| cg22501793 | Intergenic_chr1 | 0.27 |
| cg02223001 | Intergenic_chr16 | −0.27 |
Comparisons are based on 36 paired tumor DNA samples.
Selected clinical characteristics of the combined FH and EV dataset (training) and the UM dataset (testing) are shown in Table 2. In both datasets, men with no evidence of recurrence were similar in age at diagnosis to those who developed metastasis or died of PCa. As expected, men who experienced metastatic progression had higher Gleason sum tumors, a higher frequency of regional stage disease based on surgical pathology, and higher diagnostic PSA levels.
Table 2.
Clinical characteristics of the prostate cancer patients with tumor DNA methylation data included in the training and testing datasets
| FH+EV patients (Training dataset) | UM patients (Testing dataset) | |||||||||||||
|---|---|---|---|---|---|---|---|---|---|---|---|---|---|---|
| Non‐recurrence (N = 344) | Metastatic‐lethal PCa (N = 48) | Non‐recurrence (N = 11) | Metastatic‐lethal PCa (N = 23) | |||||||||||
| Characteristic | No. | % | Mean (SD) | No. | % | Mean (SD) | P‐value a | No. | % | Mean (SD) | No. | % | Mean (SD) | P‐value a |
| Age at diagnosis (years) | 58.4 (7.0) | 59.5 (6.5) | 0.30 | 60.6 (9.5) | 61.3 (8.2) | 0.84 | ||||||||
| Gleason sum | ||||||||||||||
| ≤6 | 186 | 54.1 | 7 | 14.6 | <0.01 | 6 | 54.5 | 0 | 0 | <0.01 | ||||
| 7 (3+4) | 125 | 36.3 | 13 | 27.1 | 3 | 27.3 | 8 | 34.8 | ||||||
| 7 (4+3) | 17 | 4.9 | 10 | 20.8 | 2 | 18.2 | 4 | 17.4 | ||||||
| 8‐10 | 16 | 4.7 | 18 | 37.5 | 0 | 0 | 11 | 47.8 | ||||||
| Pathological stage b | ||||||||||||||
| Local | 257 | 74.7 | 11 | 22.9 | <0.01 | 8 | 72.7 | 6 | 26.1 | 0.03 | ||||
| Regional | 87 | 25.3 | 37 | 77.1 | 3 | 27.3 | 17 | 73.9 | ||||||
| PSA (ng/mL) at diagnosis c | ||||||||||||||
| <4.0 | 64 | 18.6 | 5 | 10.4 | <0.01 | 0 | 0 | 1 | 4.3 | 0.30 | ||||
| 4.0‐9.9 | 216 | 62.8 | 21 | 43.8 | 8 | 72.7 | 13 | 56.5 | ||||||
| 10.0‐19.9 | 30 | 8.7 | 10 | 20.8 | 2 | 18.2 | 3 | 13.0 | ||||||
| ≥20 | 15 | 4.4 | 9 | 18.8 | 0 | 0 | 6 | 26.1 | ||||||
PCa = prostate cancer; FH = Fred Hutchinson; EV = Eastern Virginia Medical School; UM = University of Michigan.
Based on a t‐test (age), chi‐square or Fisher's exact test (categorical variables).
Local stage = pT2, N0/NX, M0; regional stage = pT3/T4 and/or N1, M0.
One UM patient without recurrence had missing data for PSA level at diagnosis.
After quality control and data filtering using the same procedures as for the FH and EV datasets, DNA methylation data were available for 23 men who developed metastatic‐lethal PCa and 11 who remained disease‐free in the UM dataset. The 24 drop‐outs (11 non‐recurrent, 6 metastatic‐lethal) were primarily due to low input DNA as macrodissection of tumor tissue from five slides for these patients did not yield sufficient tumor DNA for the HM450 array. Importantly, the distributions of age, Gleason sum, pathologic stage, and PSA level at diagnosis were not significantly different in either the metastatic‐lethal or the non‐recurrent PCa group when comparing those with versus without available methylation data (all P > 0.10).
Forward model selection resulted in all five technically validated CpG biomarkers being retained in the final locked model with Gleason sum (all P < 0.05). Study site was included in the model to account for the different study designs (FH, cohort; EV, nested case‐control), but the coefficients for Gleason sum and the five CpGs were similar when study site was excluded from the model. Table 3 shows the genetic and epigenetic locations of these five differentially methylated CpGs. One of the CpGs (in the PI15 gene) was hypermethylated in metastatic‐lethal versus non‐recurrent patients whereas the other four CpGs had lower methylation levels in patients with metastatic‐lethal progression. Two of the CpGs, one each in the PI15 and the FHAD1 gene, are in the promoter region.
Table 3.
Five technically validated CpGs used to calculate the prognostic DNA methylation score a
| CpG ID | Gene | Chromosome | Genetic location | Epigenetic location | β‐coefficient |
|---|---|---|---|---|---|
| Higher methylation b | |||||
| cg24349665 | PI15 | 8 | TSS200 | OpenSea | 0.70 |
| Lower methylation b | |||||
| cg07166550 | ALKBH5 | 17 | Body | S_Shore | ‐0.75 |
| cg21513610 | ATP11A | 13 | Body | S_Shore | ‐0.75 |
| cg02394978 | FHAD1 | 1 | TSS1500 | N_Shore | ‐0.72 |
| cg16713292 | KLHL8 | 4 | Body | OpenSea | ‐0.33 |
TSS = transcription start site.
DNA methylation score calculated in the training dataset; the Gleason sum β‐coefficient = 1.13
Higher or lower DNA methylation level in primary tumor tissue of men with metastatic‐lethal versus non‐recurrent prostate cancer.
The β‐coefficients for five CpGs and Gleason sum from the locked model (Table 3) were then applied to the UM patients to calculate a DNA methylation score, which ranged from −3.01 to 3.70 (median −0.04) in the testing dataset (Figure 1). The mean methylation score differed significantly between metastatic‐lethal compared to recurrence‐free patients (mean difference = 2.49, P = 6.8 × 10⁻⁶). Based on the logistic regression analysis, each unit increase in the methylation score was associated with a significantly elevated odds ratio of 4.0 (95%CI = 1.8‐14.3, P = 0.006) for metastatic‐lethal progression in the UM dataset. This result was not substantially altered when age at diagnosis, year of diagnosis, pathologic stage, or diagnostic PSA level was included in the logistic model.
Figure 1.
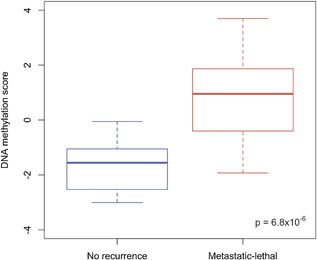
Box plots of the DNA methylation score in the UM testing dataset stratified by prostate cancer outcome status (no recurrence or metastatic‐lethal progression)
We next evaluated the ability of the DNA methylation score to predict outcomes. A ROC curve analysis (Figure 2) showed that the methylation score had better predictive performance (AUC = 0.91; pAUC = 0.037) than Gleason sum alone (AUC = 0.87; pAUC = 0.025); the addition of PSA, stage, and year of diagnosis did not substantially improve either prediction model. This represents a 4.6% higher probability of correctly classifying men at high risk for metastatic‐lethal progression, although the difference in the AUCs was not statistically significant (P = 0.33). However, the 48% increase in the pAUC for the score relative to Gleason sum alone (0.037 vs 0.025, respectively) was a significant improvement (P = 0.01). At a fixed 95% specificity, sensitivity increased by 0.21 (from 53% to 74%) when adding the methylation score. This represents a 39.6% higher probability of correctly classifying patients at high risk for developing metastatic‐lethal events, while minimizing the probability of misclassifying low‐risk men. This result agrees with our a priori decision to evaluate the methylation score at high specificity because of our translational goal of developing a biomarker test with a low false‐positive fraction (<5%).
Figure 2.
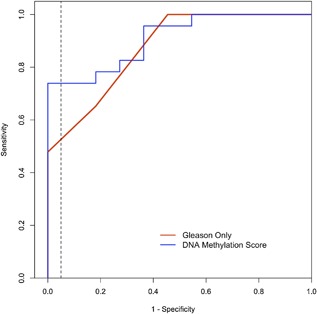
Receiver Operating Characteristic curves for predicting metastatic‐lethal versus non‐recurrent prostate cancer outcomes in the UM testing dataset. The dashed vertical line indicates 95% specificity, which corresponds to a sensitivity of 53% for Gleason sum alone compared to a sensitivity of 74% for the DNA methylation score. The red line shows the prediction performance of Gleason sum alone (AUC = 0.87; pAUC = 0.025), and the blue line shows the prediction performance of the DNA methylation score based on Gleason sum plus five CpGs (AUC = 0.91; pAUC = 0.037)
4. DISCUSSION
Recently, we identified a panel of eight differentially methylated CpGs in primary PCa that stratified patients surgically treated for localized disease who subsequently developed metastatic progression or died of their cancer from similar patients who remained recurrence‐free for at least 5 years following radical prostatectomy.13 Building upon those findings, here we report results from technical validation of these biomarkers by pyrosequencing assays. In addition, a DNA methylation score based on five technically validated CpGs and Gleason sum was developed and tested for its ability to predict deleterious outcomes in an independent dataset. Each unit increase in the score was associated with a significant four‐fold increase in the risk of metastatic‐lethal events. In an independent testing dataset, the methylation score had a better performance profile (AUC = 91%; pAUC = 0.037) than Gleason sum alone (AUC = 87%; pAUC = 0.025). Furthermore, at a fixed specificity of 95% the methylation score had a higher sensitivity compared to Gleason sum alone, 74% versus 53%, respectively.
The primary goal of this research is to improve identification of biologically aggressive prostate tumors, which have acquired a particular DNA methylation signature correlated with subsequent metastasis and lethality. Because adjuvant therapy and selection to clinical trials may be recommended for the subset of men classified as high‐risk by the methylation score, our analytical strategy was to find candidate biomarkers with a high specificity, that is, a low false‐positive rate.13 This approach should provide more confidence that a positive test result will in fact target early adjuvant therapy and more intense surveillance to patients at truly high risk for developing metastasis, avoiding overtreatment, and adverse effects of adjuvant therapies in men with low‐risk tumors.
Localized PCa treated with radical prostatectomy has a spectrum of cancer‐related outcomes, from lasting cure to biochemical recurrence, metastatic progression, and disease‐specific mortality. Molecular biomarkers to identify tumors with high metastatic potential soon after diagnosis (eg, at radical prostatectomy) could improve the accuracy of existing clinical and pathological features used for prognostication. Several earlier tumor tissue‐based biomarker studies have been conducted in this context,8, 10 and a gene expression‐based test (Decipher™) was developed for use specifically in radical prostatectomy patients to assess risk of metastasis within 5 years after surgery.24 The AUC for prediction of metastatic progression post‐surgery based on the Decipher™ assay ranges from 75% to 80% across individual studies, which focused on patients with adverse clinicopathological features at surgery.10 A recent meta‐analysis reported a C‐index for 10‐year metastatic progression of 76% for a clinical model alone that increased to 81% with inclusion of Decipher™.11 Relative to the mRNA‐based assay, our tumor DNA‐based methylation score for predicting metastasis‐PCa death demonstrated an AUC of 91% in an independent testing dataset, although the result is based on a limited number of patients. It is difficult, however, to compare AUCs across study populations and assays based on the different clinicopathological models and platforms used in these biomarker studies.
A few smaller investigations have reported DNA methylation alterations that associate with more aggressive PCa. Bahsin et al25 profiled the methylome of 15 prostate tumors (six low grade, nine high grade) obtained at radical prostatectomy and seven benign prostate samples. They identified 41 significantly (FDR P ≤ 9.98 × 10⁻⁵) differentially methylated regions (DMRs) that were unique to the high‐grade tumors. None of the genes encompassed in those DMRs, however, overlaps with the genes in which our validated CpGs are located. In another study of 14 patients, matched primary tumor and pelvic lymph node metastases were profiled using the HM450 array.26 Comparing aggressive versus non‐aggressive primary PCa foci based on correlated methylation changes observed in lymph node metastases, no CpGs that distinguished between the two groups were found. Mundbjerg et al26 then profiled adjacent‐normal samples from PCa patients for comparison and defined a 25‐CpG aggressiveness classifier (FDR P < 0.3 for 21 of the 25 probes), but the CpGs in their classifier do not overlap with those in our methylation score. Interestingly, the DNA methylation profile of the metastatic site(s) was similar to that in the primary tumor of individual patients, providing strong evidence that methylation changes in a primary tumor can reveal its aggressiveness potential. Differences in these study results may reflect differences in study design, sample size, and the use of intermediate outcomes in other studies as compared to our stronger endpoint of metastatic‐lethal events.
Our study had a number of strengths, including a focus on the most serious disease phenotype, that is, metastatic‐lethal PCa. In addition, we developed pyrosequencing assays for technical validation of our earlier results generated using the HM450 array. Analysis of DNA methylation at candidate CpGs by pyrosequencing provides quantitative resolution, requires less tumor DNA, and is less expensive than methylation arrays, all of which are important considerations for future clinical studies and translation of these findings. The methylation score incorporates Gleason sum in its calculation, reflecting our goal of finding genomic biomarkers that are complimentary (ie, have added value) to tumor grade for predicting adverse outcomes. Another strength of the study is its use of independent training and testing datasets to define, create, and then test the methylation score, which avoids over‐fitting of the data. Lastly, as discussed in our earlier paper,13 there is biological plausibility for the genes encompassing the CpG sites included in the DNA methylation score contributing to tumor aggressiveness.
There are also several limitations of our study, including the small sample size of the testing dataset. This was further reduced due to technical drop‐outs during the DNA methylation profiling. Although the HM450 array has a fairly low DNA input requirement (500 ng), the amount of tumor DNA available from five (5‐μm thickness) slides proved insufficient for some cases. This problem may be mitigated in future studies as pyrosequencing and other recently developed methods for assessing DNA methylation at individual CpG sites have lower DNA requirements. In terms of our results, however, we did confirm that clinical and pathological factors related to PCa aggressiveness did not differ substantially between patients with versus without methylation data in the group who developed metastatic‐lethal progression or in those who remained recurrence‐free. Thus, the men analyzed in the testing dataset were representative of the outcome groups of interest. A universal challenge for biomarker studies focused on the most serious disease phenotype is the need for a long observation period to ascertain outcomes in men surgically treated for clinically localized disease; many years of follow‐up are required to accrue cases who eventually develop metastases and die of PCa. Even though our DNA methylation score was developed based on this strong clinical endpoint, it needs further evaluation in larger, ideally prospective clinical studies.
In summary, we have created and validated a tumor‐tissue based DNA methylation score to predict metastatic progression and PCa death in men diagnosed with clinically localized PCa. Compared to Gleason sum alone, the score incorporating five CpGs and Gleason sum provided better prognostic stratification, with a 4.6% increase in AUC (0.91 vs 0.87) and a 48% increase in pAUC (0.037 vs 0.025). The score increased sensitivity by 0.21 (from 53% for Gleason sum alone to 74% for the score) at 95% specificity, representing a 39.6% improvement in identification of truly high‐risk men who may benefit from adjuvant therapy and more intense surveillance for metastatic progression following radical prostatectomy. In terms of clinical translation, at 100% specificity the DNA methylation score was able to identify six additional high‐risk patients (ie, 26% of the 23 patients) with metastatic‐lethal events in the testing dataset who would have been missed based on the use of Gleason sum alone or Gleason sum, diagnostic PSA and pathologic stage combined for risk stratification. This indicates that with high specificity (<5% false‐positives) the methylation score could markedly improve the selection of patients at high risk for metastatic‐lethal progression, which is particularly relevant for those patients (over 25% in the testing dataset) who may be misclassified as low risk and forego potentially life‐saving adjuvant treatment. Given these promising results, this prognostic tumor DNA methylation score warrants further evaluation for its clinical utility and ability to improve PCa patient outcomes.
CONFLICTS OF INTEREST
The authors declare no potential conflicts of interest.
Supporting information
Additional supporting information may be found online in the Supporting Information section at the end of the article.
Table S1. Pyrosequencing primer sequencesa for assessing DNA methylation of eight CpG sites.
Figure S1. Scatter plots comparing pyrosequencing and HumanMethylation450 array results for eight CpGs in two datasets (FH= Fred Hutchinson; EV= Eastern Virginia).
ACKNOWLEDGMENTS
This work was supported by grants from the National Cancer Institute (R01 CA056678, R01 CA092579, K05 CA175147 to JLS, the Pacific Northwest Prostate Cancer SPORE P50 CA097186 and the University of Michigan Prostate Cancer SPORE P50 CA186786), with additional support provided by the Fred Hutchinson Cancer Research Center (P30 CA015704), and the Intramural Research Programs of the National Human Genome Research Institute and the National Institute of Environmental Health Sciences. Illumina, Inc. provided the arrays and generated the methylation data. MSG is the recipient of a Dutch Cancer Society Fellowship (BUIT 2014–6645). SAT was supported by the A. Alfred Taubman Medical Research Institute.
The authors thank Drs. Beatrice Knudson, Antonio Hurado‐Coll, and Xiaotun Zhou for their assistance with the pathology, and the GU Tumor Biorepository, Eastern Virginia Medical School. We also thank all the men who participated in these studies.
Zhao S, Leonardson A, Geybels MS, et al. A five‐CpG DNA methylation score to predict metastatic‐lethal outcomes in men treated with radical prostatectomy for localized prostate cancer. Prostate. 2018;78: 1084–1091. 10.1002/pros.23667
REFERENCES
- 1. Patrikidou A, Loriot Y, Eymard J‐C, et al. Who dies from prostate cancer? Prostate Cancer Prostatic Dis. 2014; 17:348–352. [DOI] [PubMed] [Google Scholar]
- 2. Howlader N NA, Krapcho M, Garshell J, et al. SEER Cancer Statistics Review, 1975– 2013. National Cancer Institute, Bethesda, MD Available from: http://seercancergov/csr/1975 2013.
- 3. Gray PJ, Lin CC, Cooperberg MR, Jemal A, JA E. Temporal trends and the impact of race, insurance, and socioeconomic status in the management of localized prostate cancer. Eur Urol. 2017; 71:729–737. [DOI] [PubMed] [Google Scholar]
- 4. DeSantis CE, Lin CC, Mariotto AB, et al. Cancer treatment and survivorship statistics, 2014. CA Cancer J Clin. 2014; 64:252–271. [DOI] [PubMed] [Google Scholar]
- 5. Boorjian SA, Eastham JA, Graefen M, et al. A critical analysis of the long‐term impact of radical prostatectomy on cancer control and function outcomes. Eur Urol. 2012; 61:664–675. [DOI] [PubMed] [Google Scholar]
- 6. Eggener SE, Scardino PT, Walsh PC, et al. Predicting 15‐year prostate cancer specific mortality after radical prostatectomy. J Urol. 2011; 185:869–875. [DOI] [PMC free article] [PubMed] [Google Scholar]
- 7. Freedland SJ, Humphreys EB, Mangold LA, et al. Risk of prostate cancer‐specific mortality following biochemical recurrence after radical prostatectomy. JAMA. 2005; 294:433–439. [DOI] [PubMed] [Google Scholar]
- 8. Ross AE, D'Amico AV, Freedland SJ. Which, when and why? Rational use of tissue‐based molecular testing in localized prostate cancer. Prostate Cancer Prostatic Dis. 2016; 19:1–6. [DOI] [PubMed] [Google Scholar]
- 9. Bostrom PJ, Bjartell AS, Catto JWF, et al. Genomic predictors of outcome in prostate cancer. Eur Urol. 2015; 68:1033–1044. [DOI] [PubMed] [Google Scholar]
- 10. Moschini M, Spahn M, Mattei A, Cheville J, Karnes RJ. Incorporation of tissue‐based genomic biomarkers into localized prostate cancer clinics. BMC Medicine. 2016; 14:67. [DOI] [PMC free article] [PubMed] [Google Scholar]
- 11. Spratt DE, Yousefi K, Deheshi S, et al. Individual patient‐level meta‐analysis of the performance of the Decipher genomic classifier in high‐risk men after prostatectomy to predict development of metastatic disease. J Clin Oncol. 2017; 35:1991–1998. [DOI] [PMC free article] [PubMed] [Google Scholar]
- 12. Hendriks RJ, van Oort IM, Schalken JA. Blood‐based and urinary prostate cancer biomarkers: a review and comparison of novel biomarkers for detection and treatment decisions. Prostate Cancer Prostatic Dis. 2017; 20:12–19. [DOI] [PubMed] [Google Scholar]
- 13. Zhao S, Geybels MS, Leonardson A, et al. Epigenome‐wide tumor DNA methylation profiling identifies novel prognostic biomarkers of metastatic‐lethal progression in men diagnosed with clinically localized prostate cancer. Clin Cancer Res. 2017; 23:311–319. [DOI] [PMC free article] [PubMed] [Google Scholar]
- 14. Rubicz R, Zhao S, Wright JL, et al. Gene expression panel predicts metastatic‐lethal prostate cancer outcomes in men diagnosed with clinically localized prostate cancer. Mol Oncol. 2017; 11:140–150. [DOI] [PMC free article] [PubMed] [Google Scholar]
- 15. Massie CE, Mills IG, Lynch AG. The importance of DNA methylation in prostate cancer development. J Steroid Biochem Mol Biol. 2017; 166:1–15. [DOI] [PubMed] [Google Scholar]
- 16. Friedlander TW, Roy R, Tomlins SA, et al. Common structural and epigenetic changes in the genome of castration‐resistant prostate cancer. Cancer Res. 2012; 72:616–625. [DOI] [PubMed] [Google Scholar]
- 17. Paziewska A, Dabrowska M, Goryca K, et al. DNA methylation status is more reliable than gene expression at detecting cancer in prostate biopsy. Br J Cancer. 2014; 111:781–789. [DOI] [PMC free article] [PubMed] [Google Scholar]
- 18. Stanford JL, Wicklund KG, McKnight B, Daling JR, Brawer MK. Vasectomy and risk of prostate cancer. Cancer Epidemiol Biomarkers Prev. 1999; 8:881–886. [PubMed] [Google Scholar]
- 19. Agalliu I, Salinas CA, Hansten PD, Ostrander EA, Stanford JL. Statin use and risk of prostate cancer: results from a population‐based epidemiologic study. Am J Epidemiol. 2008; 168:250–260. [DOI] [PMC free article] [PubMed] [Google Scholar]
- 20. Bibikova M, Barnes B, Tsan C, et al. High density DNA methylation array with single CpG site resolution. Genomics. 2011; 98:288–295. [DOI] [PubMed] [Google Scholar]
- 21. Moskalev EA, Zavgorodnij MG, Majorova SP, et al. Correction of PCR‐bias in quantitative DNA methylation studies by means of cubic polynomical regression. Nucleic Acids Res. 2011; 39:e77. [DOI] [PMC free article] [PubMed] [Google Scholar]
- 22. Maksimovic J, Gordon L, Oshlack A. SWAN: Subset‐quantile within array normalization for Illumina infinium HumanMethylation450 BeadChips. Genome Biol. 2012; 13:R44. [DOI] [PMC free article] [PubMed] [Google Scholar]
- 23. Hansen K. IlluminaHumanMethylation450kanno.ilmn12.hg19: Annotation for Illumina's 450k methylation arrays. R package version 0.2.1.
- 24. Erho N, Crisan A, Vergara IA, et al. Discovery and validation of a prostate cancer genomic classifier that predicts early metastasis following radical prostatectomy. PLoS ONE. 2013; 8:e66855. [DOI] [PMC free article] [PubMed] [Google Scholar]
- 25. Bhasin JS, Lee BH, Matkin L, et al. Methylome‐wide sequencing detects DNA hypermethylation distinguishing indolent from aggressive prostate cancer. Cell Reports. 2015; 13:2135–2146. [DOI] [PMC free article] [PubMed] [Google Scholar]
- 26. Mundbjerg K, Chopra S, Alemozaffar M, et al. Identifying aggressive prostate cancer foci using a DNA methylation classifier. Genome Biol. 2017; 18:3. [DOI] [PMC free article] [PubMed] [Google Scholar]
Associated Data
This section collects any data citations, data availability statements, or supplementary materials included in this article.
Supplementary Materials
Additional supporting information may be found online in the Supporting Information section at the end of the article.
Table S1. Pyrosequencing primer sequencesa for assessing DNA methylation of eight CpG sites.
Figure S1. Scatter plots comparing pyrosequencing and HumanMethylation450 array results for eight CpGs in two datasets (FH= Fred Hutchinson; EV= Eastern Virginia).