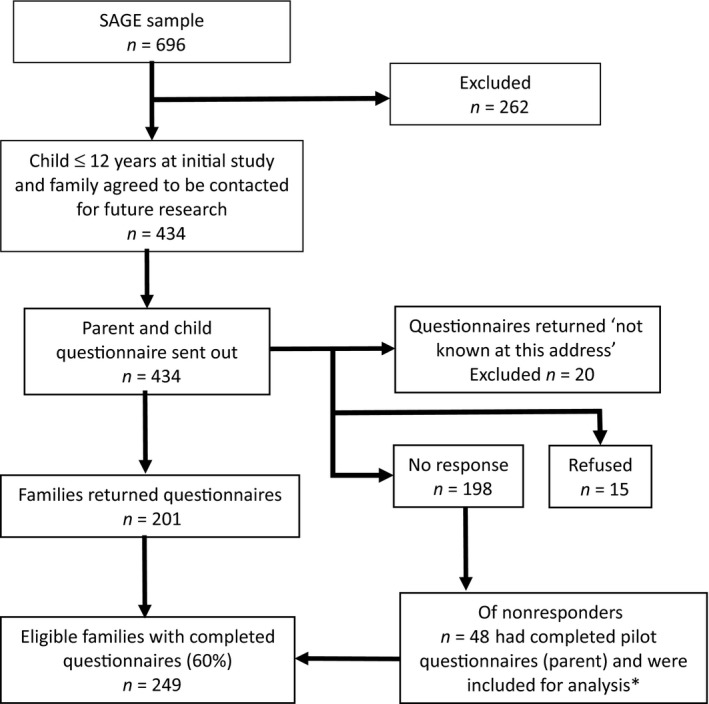
Figure 1.

Flow chart of participants for Study of ADHD and Mood. SAGE, Study of ADHD, Genes and Environment. *Pilot MFQ data were collected in 2013–2014. Although the children in the pilot questionnaire group were younger than the rest of the sample, the MFQ scores did not significantly differ so they were included in the analysis
